
Fig. 2
- ID
- ZDB-FIG-240118-2
- Publication
- Tagore et al., 2023 - GABA regulates electrical activity and tumor initiation in melanoma
- Other Figures
- All Figure Page
- Back to All Figure Page
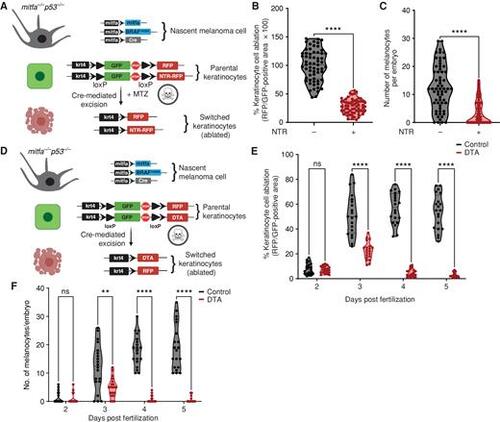
Melanoma/keratinocyte communication drives melanoma initiation. A, Schematic representation of the zebrafish genetic reporter system to detect melanoma/keratinocyte communication and specifically ablate melanoma-associated keratinocytes (RFP-positive, switched) using the transgenic expression of NTR2.0 and MTZ treatment (created with BioRender.com). B, Switched keratinocyte ablation calculated as percentage of RFP-positive area normalized to GFP-positive area in 3 days post-fertilization (dpf) zebrafish embryos (± NTR2.0 expression) in keratinocytes. Absolute values were normalized to no NTR control to calculate cell-ablation efficiency. Data represent n = 60 control fish (negative for NTR) and n = 60 NTR2.0 fish (positive for NTR) pooled from 3 biological replicates. Error bars, SD; P values generated by two-tailed unpaired t test; ****, P < 0.0001. C, Number of pigmented melanocytes per embryo in ± NTR conditions. Data represent n = 60 control fish and n = 60 NTR fish pooled from 3 biological replicates. Error bars, SD; P values generated by two-tailed unpaired t test; ****, P < 0.0001. D, Schematic representation of the zebrafish genetic reporter system to detect melanoma keratinocyte communication and specifically ablate melanoma-associated keratinocytes (RFP-positive, switched) using the transgenic expression of DTA (diphtheria toxin gene A chain; created with BioRender.com). E, Switched keratinocyte ablation calculated as percentage of RFP-positive area normalized to GFP-positive area in 2, 3, 4, and 5 dpf zebrafish embryos (± DTA expression) in keratinocytes. Absolute values were normalized to no DTA control to calculate cell-ablation efficiency. Data represent n = 20 control fish per time point (negative for mitfa-Cre) and n = 20 DTA fish per time point (positive for mitfa-Cre) pooled from 3 biological replicates. Error bars, SD; P values generated by multiple two-tailed paired t test; ****, P < 0.0001. ns, not significant. F, Number of pigmented melanocytes per embryo in 2, 3, 4, and 5 dpf embryos ± DTA expression. Data represent n = 20 control fish per time point (negative for mitfa-Cre) and n = 40 DTA fish per time point (positive for mitfa-Cre) pooled from 3 biological replicates. Error bars, SD; P values generated by multiple two-tailed paired t test; **, P < 0.01; ****, P < 0.0001. |