
|
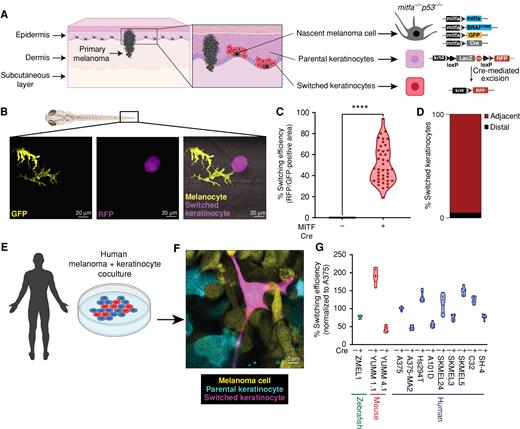
Fig. 1 Nascent melanoma cells are in direct communication with keratinocytes. A, Schematic representation of the genetic reporter system to identify melanoma/keratinocyte communication (created with BioRender.com). Left, the epidermal melanin unit is disrupted in primary melanoma; zoomed-in image shows nascent melanoma cells and keratinocytes in direct physical contact. Right, the genetic reporter system for detecting melanoma keratinocyte communication in zebrafish casper F0 embryos with the genotype p53−/−mitfa:BRAFV600E injected with the indicated melanocyte and keratinocyte reporter constructs (± mitfa:Cre). B, Representative image of an F0 zebrafish embryo with nascent melanoma cells overexpressing Cre and palmGFP in direct communication with a switched keratinocyte overexpressing RFP. Individual cells are pseudocolored as indicated. C, Percentage switching efficiency calculated as percentage of RFP-positive area normalized to GFP-positive area in 3 days post-fertilization (dpf) zebrafish embryos. Data represent n = 40 control fish (negative for mitfa-Cre) and n = 40 switch fish (positive for mitfa-Cre) pooled from 3 biological replicates. Error bars, SD; P values generated by two-tailed unpaired t test; ****, P < 0.0001. D, Bar plot showing percentage of switched keratinocytes (RFP-positive) in direct contact (adjacent) or not in direct contact (distal) with a nascent melanoma cell (palmGFP-positive). Data are pooled from 3 biological replicates (n = 60). E, Schematic representation of human melanoma/keratinocyte coculture (schematic created with BioRender.com). F, Representative confocal image of human melanoma/keratinocyte coculture with nonswitched keratinocytes, melanoma cells, and switched keratinocytes pseudocolored as indicated. G, Percentage switching efficiency in human keratinocytes when cocultured with zebrafish, mouse, or human melanoma cell lines calculated as the number of switched keratinocytes per well, normalized to the human melanoma cell line A375 (ratio: 1:3, keratinocyte:melanoma). No switching was observed in the absence of Cre-expressing melanoma cell lines. Data represent n = 6 for control cocultures (no Cre) and n = 6 for switched cocultures (+ Cre) pooled from 3 biological replicates for each cell line indicated. Error bars, SD.