
|
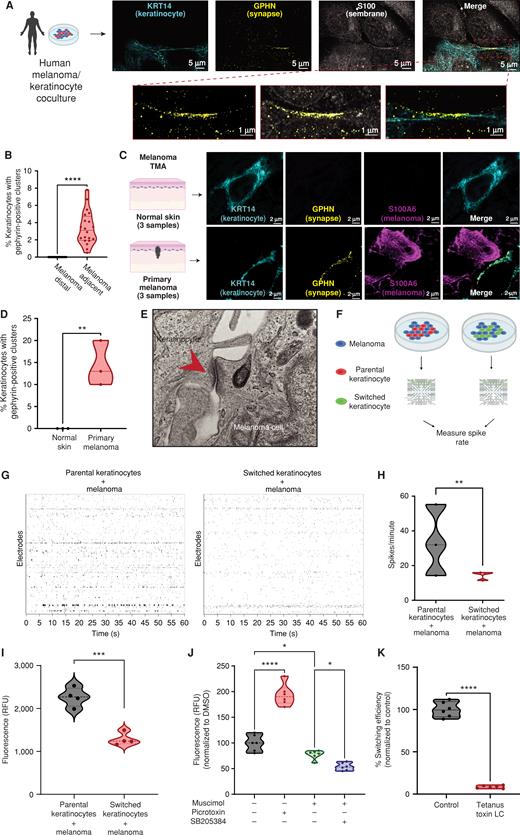
Fig. 4 Melanoma cells form specialized cell–cell junctions with keratinocytes. A, Representative image of immunostaining for KRT14 (keratinocyte marker), S100 (membrane marker), and gephyrin (postsynapse GABAergic marker) in human melanoma/keratinocyte cocultures. Gephyrin-positive clusters are observed in keratinocytes only at sites of melanoma cell contact (zoomed in). Individual cells are pseudocolored as indicated. Left schematic created with BioRender.com. B, Quantification of gephyrin-positive clusters in melanoma/keratinocyte cocultures. Each datapoint represents a microscopic field quantified for the presence of keratinocyte gephyrin-positive clusters pooled from 4 biological replicates (n = 20). P values generated by unpaired t test; ****, P < 0.0001. C, Representative images of a patient malignant melanoma in situ and normal skin sample with immunostaining for KRT14 (keratinocyte marker), S100A6 (melanoma marker), and gephyrin (postsynapse GABAergic marker). Individual cells are pseudocolored as indicated. Left schematic created with BioRender.com. D, Violin plots showing percentage of keratinocytes with gephyrin-positive clusters in melanoma patient samples and normal skin. Data represent samples from n = 3 melanoma in situ patients, n = 3 normal skin; P values generated by unpaired t test; **, P < 0.01. E, Transmission electron microscopy of melanoma/keratinocyte cocultures with specialized cell–cell junction structures indicated with red arrowhead. A representative image is shown. F, Schematic representation for MEA experimental setup in human melanoma cocultures with parental or switched keratinocytes for 48 hours. Created with BioRender.com. G, Representative spike rastergrams of 1 minute of activity on MEA chip in 48-hour melanoma/keratinocyte cocultures. H, Quantification of MEA activity in 48-hour melanoma/keratinocyte cocultures calculated as spikes per minute (ratio: 1:5, melanoma:keratinocyte). Data represent 3 biological replicates per condition, with P values calculated using multiple unpaired t test using the Holm–Šídák method for multiple comparisons; **, P < 0.01. I, Calcium spike activity in cocultures of melanoma cells with switched or parental keratinocytes. RFU is relative fluorescence units measured using the calcium dye Rhod-4 (ratio: 1:5, melanoma:keratinocyte). Data represent 3 biological replicates per condition calculated using unpaired t test; ***, P < 0.001. J, Calcium spike activity in melanoma/keratinocyte cocultures upon the addition of a GABA-A agonist (muscimol), a GABA-A antagonist (picrotoxin), and a GABA-A allosteric modulator (SB205384; ratio: 1:5, melanoma:keratinocyte). RFU is a relative fluorescence unit measured using the calcium dye Cal-520. Data represent 6 biological replicates per condition calculated using one-way ANOVA with multiple comparisons; *, P < 0.05; ****, P < 0.0001. K, Percentage switching efficiency calculated as number of switched cells per well normalized to control upon melanoma-specific expression of tetanus toxin light chain (LC) in melanoma/keratinocyte cocultures for 48 hours pooled from 6 biological replicates (n = 12; ratio: 1:3, keratinocyte:melanoma). Error bars, SD; P values generated by unpaired t test; ****, P < 0.0001.