FIGURE SUMMARY
Title

Super-Resolution Imaging Reveals the Nanoscale Distributions of Dystroglycan and Integrin Itga7 in Zebrafish Muscle Fibers

Authors
Shivanna, K., Astumian, M., Raut, P., Ngo, V.N., Hess, S.T., Henry, C.
Source
Full text @ Biomedicines

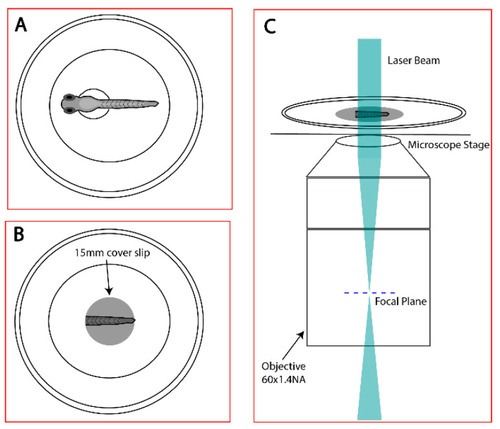
Schematic representation of the sample preparation right before FPALM imaging. (A) Fixed zebrafish in 35 mm MatTek dishes. (B) Deyolked zebrafish in same dish with 15 mm circular coverslip on top of the fish. (C) Sample placed on to the microscope stage with oil objective of 60× 1.4 NA.

Experimental setup for single and two color FPALM in wide field illumination.

(A) Confocal image of a 72 hpf zebrafish antibody-stained for Dystroglycan, with Dystroglycan seen mainly at the myotendinous junction (MTJ), indicated by arrows. (A1) Confocal image shows Dystroglycan at both the MTJ and sarcolemma surrounding individual muscle fibers. (B) Confocal image shows transgenically expressed Dystroglycan–GFP is present at the (B3) MTJ, (B2) sarcolemma membranes, and (B1) t-tubules. (C) Confocal image of Dystroglycan-Dendra2 muscle fiber in green, (C1) merged Dystroglycan-Dendra2 muscle fiber in green with ryanodine receptor on t-tubules in magenta, and (C2) merged Dystroglycan-Dendra2 in green with phalloidin staining of actin in cyan (D) Confocal image of 48 hpf muscle fiber expressing Dystroglycan-Dendra2 fairly continuously at MTJ and t-tubule. (E) Super-resolution, FPALM image render, of 48 hpf muscle fiber expressing Dystroglycan-Dendra2, demonstrates that individual molecules can be localized and Dystroglycan can now be seen as clusters at the MTJ and t-tubule. Magnifications in the green boxed regions highlight the differing levels of information about the distribution of Dystroglycan at the MTJ that can be obtained from confocal and super-resolution images.

(A) Shows the cropped region of the muscle fiber imaged using the Leica DMi8 confocal and 25× water lens. Purple line with circles indicates the regions where the intensities of the pixels are measured. (B)Two-dimensional graph of intensities of pixels along a line within the image. X-axis represents distance in microns and Y-axis represents amplitude intensity. Purple dots show the position of maximum intensity and distance between maximum intensity represents the distance between the t-tubules. The width of the t-tubule (represented by green dotted line) was obtained by measuring the width at half maximum of the intensity peak, represented by a red dotted line.

(A) Cropped region of the muscle fiber imaged using FPALM. The purple line shows the path along which the intensities of the pixels are measured. Purple circles show positions of intensity peaks. (B) Plot of pixel intensities vs. distance along the line shown in A. Purple dots show the positions of maximum intensity. The distance between intensity maxima represents the distance between the t-tubules. The apparent width of the t-tubule (represented by the green dotted line) was obtained by measuring the full width at half maximum of the intensity peak, represented by the red dotted line.

(A) FPALM image showing Dystroglycan-Dendra2 localizations in whole zebrafish muscle fiber and (B) its corresponding brightfield image. (C) Dystroglycan–Dendra2 localizations are seen in the MTJ, sarcolemma, and t-tubule regions without density thresholding. (D) Localizations thresholded to those areas above the average localization density (localizations per μm2). (E) Localizations after thresholding at or above three times the average density show few remaining at the t-tubule, indicating lower density in the t-tubule region. (F) The remaining localizations after thresholding at or above five times the average density indicate that the MTJ is the most dense region for localizations, followed by the sarcolemma.

(A) Binning Dystroglycan densities by region on muscle fibers, with 3 as most dense and 1 as least dense. (B) Average cluster area of Dystroglycan clusters in MTJ, sarcolemma and t-tubule regions estimated by cluster analysis.

(A) Two-color FPALM image rendered from muscle fiber expressing Dystroglycan-Dendra2 and Itga7-PAmKate. Areas of colocalization of Dystroglycan and integrin are shown by blue filled carats. Clusters of Itga7 alone are shown by yellow arrowheads. (B) Magnified view of the region in the cyan box from panel A highlights colocalizations of Dystroglycan and integrin at the MTJ. Scale bar = 1 μm.

Acknowledgments
This image is the copyrighted work of the attributed author or publisher, and ZFIN has permission only to display this image to its users. Additional permissions should be obtained from the applicable author or publisher of the image. Full text @ Biomedicines