
FIGURE
Figure 1
- ID
- ZDB-FIG-230731-76
- Publication
- Shivanna et al., 2023 - Super-Resolution Imaging Reveals the Nanoscale Distributions of Dystroglycan and Integrin Itga7 in Zebrafish Muscle Fibers
- Other Figures
- All Figure Page
- Back to All Figure Page
Figure 1
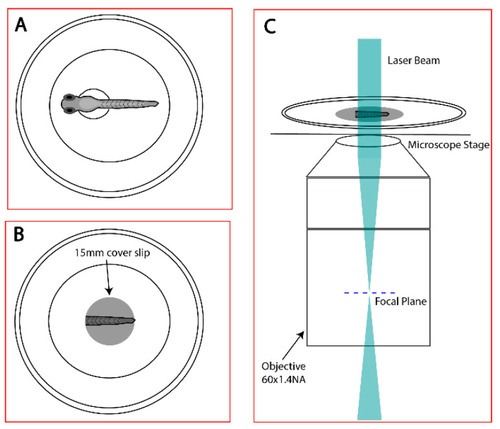
Schematic representation of the sample preparation right before FPALM imaging. ( |
Expression Data
Expression Detail
Antibody Labeling
Phenotype Data
Phenotype Detail
Acknowledgments
This image is the copyrighted work of the attributed author or publisher, and
ZFIN has permission only to display this image to its users.
Additional permissions should be obtained from the applicable author or publisher of the image.
Full text @ Biomedicines