
- Title
-
Protective mechanisms of a microbial oil against hypercholesterolemia: evidence from a zebrafish model
- Authors
- Gora, A.H., Rehman, S., Dias, J., Fernandes, J.M.O., Olsvik, P.A., Sørensen, M., Kiron, V.
- Source
- Full text @ Front Nutr
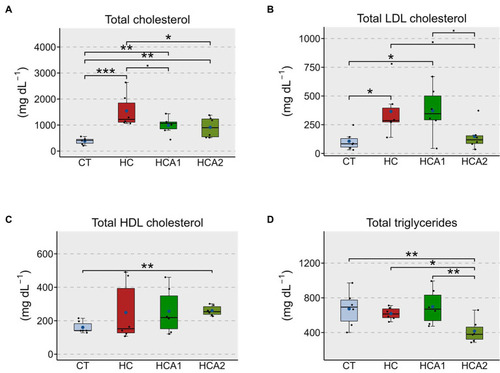
Alteration of the plasma lipids in zebrafish fed different experimental diets for a period of 12 weeks. Boxplots show total cholesterol |
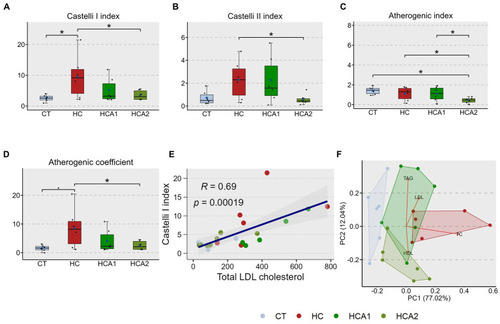
Alteration of the cardiovascular disease (CVD) risk indices in zebrafish fed different experimental diets for a period of 12 weeks. Boxplots show Castelli I index |
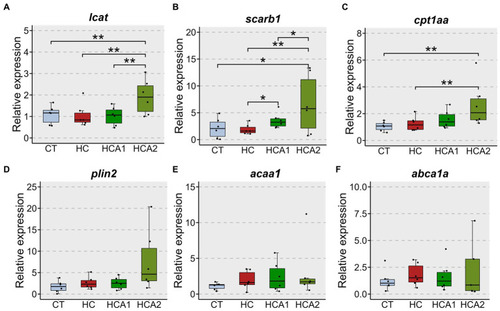
Relative expression of selected genes in the liver of zebrafish fed different experimental diets. |
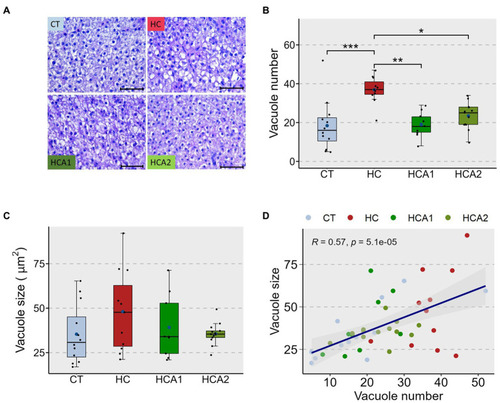
Histomorphology of the liver of zebrafish fed different experimental diets for a period of 12 weeks. Representative histological images |
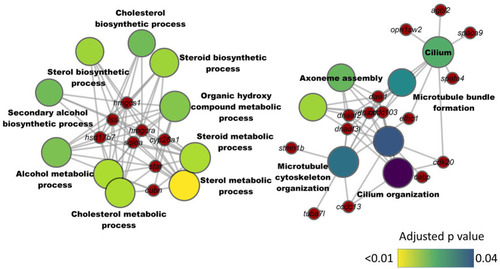
Network plot showing the link between enriched GO terms and the associated genes that were downregulated in the intestine of zebrafish fed high cholesterol diet. The significantly downregulated genes from the HC vs. CT comparison are written on the red nodes. Only the non-redundant GO terms are labelled in the network plot. For each GO term, the gradient color varies with the adjusted |

Gene ontology (GO) term enrichment based on the downregulated genes in the HCA1 group. Chord diagram showing the link between the enriched GO terms and the associated downregulated genes from the HCA1 vs. CT group comparison. Genes that were considered for the enrichment analyses are shown on the left half of the circle. The gradient color bar intensity varies with the Log2 fold change. |
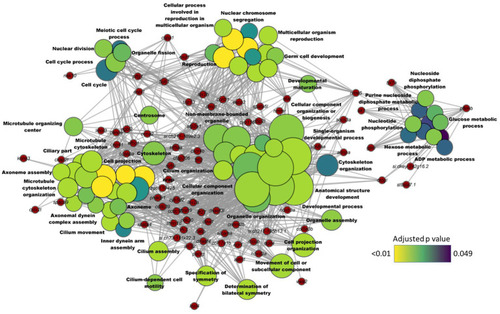
Network plot showing the link between enriched GO terms and the associated genes that were downregulated in zebrafish fed microbial oil (HCA2) supplemented diet. The significantly downregulated genes (HCA2 vs. CT) are written on the red nodes. Only the non-redundant GO terms are labelled and for each GO term, the gradient color varies with the adjusted p value (Benjamini-Hochberg method). Adjusted |
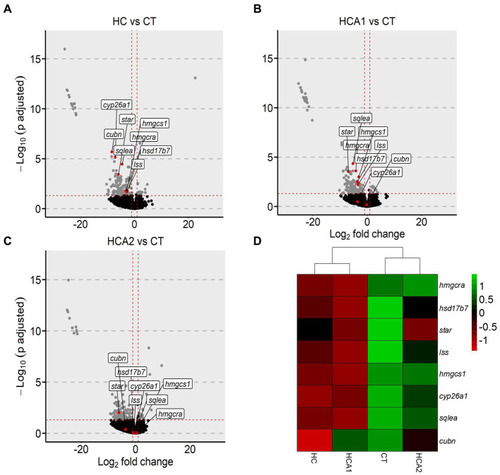
Alteration of genes related to cholesterol biosynthesis in zebrafish fed high cholesterol diet with and without microbial oil. Volcano plots highlighting the fold-changes in the intestinal cholesterol biosynthesis-related genes in |
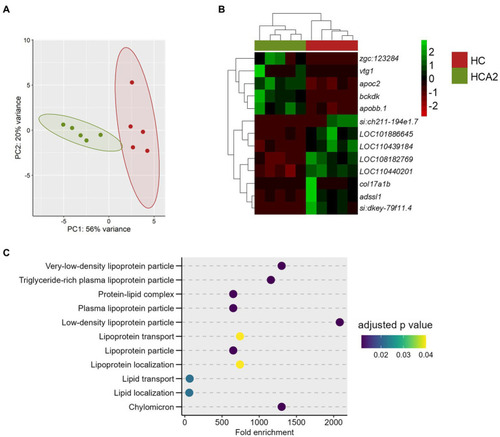
Differences in the transcriptome of the HCA2 and HC groups. Principal component analysis |
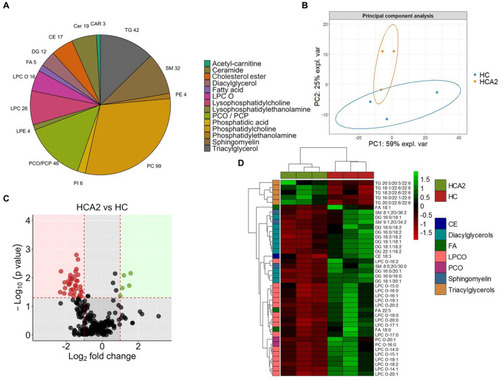
Differences in the lipid classes and species in the plasma of zebrafish fed the high cholesterol diet with and without microbial oil for a period of 12 weeks. Pie chart |
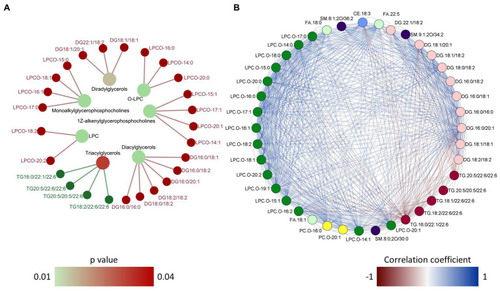
Over representation analysis and correlation network of the differentially abundant lipid species. Network plot |