
FIGURE
Figure 7
- ID
- ZDB-FIG-230712-22
- Publication
- Gora et al., 2023 - Protective mechanisms of a microbial oil against hypercholesterolemia: evidence from a zebrafish model
- Other Figures
- All Figure Page
- Back to All Figure Page
Figure 7
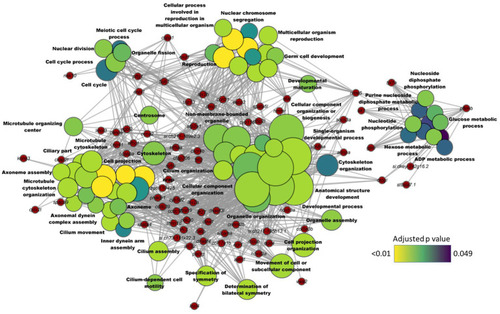
Network plot showing the link between enriched GO terms and the associated genes that were downregulated in zebrafish fed microbial oil (HCA2) supplemented diet. The significantly downregulated genes (HCA2 vs. CT) are written on the red nodes. Only the non-redundant GO terms are labelled and for each GO term, the gradient color varies with the adjusted p value (Benjamini-Hochberg method). Adjusted |
Expression Data
Expression Detail
Antibody Labeling
Phenotype Data
Phenotype Detail
Acknowledgments
This image is the copyrighted work of the attributed author or publisher, and
ZFIN has permission only to display this image to its users.
Additional permissions should be obtained from the applicable author or publisher of the image.
Full text @ Front Nutr