IMAGE

Figure 2

ID
ZDB-IMAGE-230712-16
Source
Figures for Gora et al., 2023
Image
Figure Caption

Figure 2

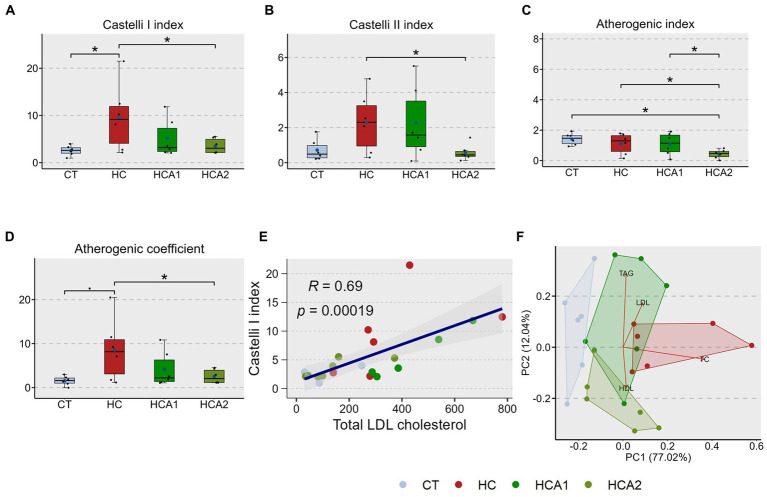
Alteration of the cardiovascular disease (CVD) risk indices in zebrafish fed different experimental diets for a period of 12 weeks. Boxplots show Castelli I index (A), Castelli II index (B), Atherogenic index (C) and Atherogenic coefficient (D) of plasma from the fish. Blue dots inside boxplots indicate the mean values of the corresponding groups. Scatter plot (E) shows the correlation between Castelli I index and total LDL cholesterol levels. Biplot (F) indicates the separation of the CT and HCA2 groups from the other 2 study groups and variables associated with each group. CT-fish fed the control diet; HC-fish fed the high cholesterol diet (5.1% inclusion); HCA1-fish fed microbial oil (3.1% inclusion); HCA2-fish fed microbial oil (6.6% inclusion). *p < 0.05 and p < 0.1. Each treatment group consisted of six biological replicates.

Acknowledgments
This image is the copyrighted work of the attributed author or publisher, and ZFIN has permission only to display this image to its users. Additional permissions should be obtained from the applicable author or publisher of the image. Full text @ Front Nutr