IMAGE

Figure 10

ID
ZDB-IMAGE-230712-23
Source
Figures for Gora et al., 2023
Image
Figure Caption

Figure 10

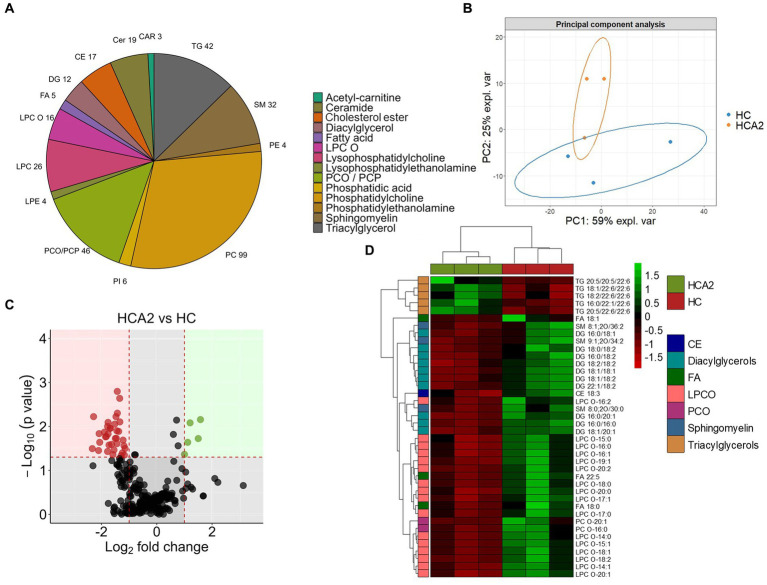
Differences in the lipid classes and species in the plasma of zebrafish fed the high cholesterol diet with and without microbial oil for a period of 12 weeks. Pie chart (A) of lipid classes in the plasma of zebrafish fed the high cholesterol (HC) diet and microbial oil supplemented (HCA2) diet. PCA (B) of the lipidome data from the 6 plasma samples that were used for the analysis (n = 3 per group). The first two components captured 59 and 25% of the variation of the data, respectively. (C) Volcano plot illustrating the differentially abundant (|Log2 fold-change| ≥ 1, p value < 0.05) lipid species in the HCA2 vs. HC diet group comparison. Red dots indicate downregulated and green dots indicate upregulated lipid species in the HCA2 group compared to the HC group. Heatmap (D) showing diet-group based hierarchical clustering of 40 differentially abundant lipid species.

Acknowledgments
This image is the copyrighted work of the attributed author or publisher, and ZFIN has permission only to display this image to its users. Additional permissions should be obtained from the applicable author or publisher of the image. Full text @ Front Nutr