IMAGE

Figure 11

ID
ZDB-IMAGE-230712-24
Source
Figures for Gora et al., 2023
Image
Figure Caption

Figure 11

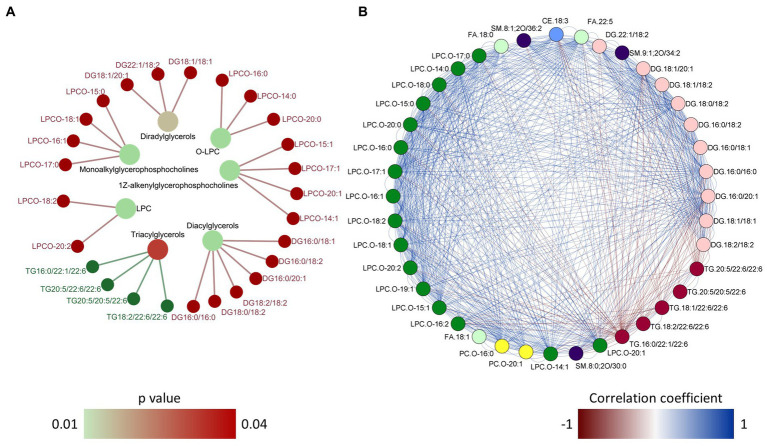
Over representation analysis and correlation network of the differentially abundant lipid species. Network plot (A) showing the link between the enriched lipid classes and differentially abundant lipid species in the plasma of zebrafish. Over representation analysis was performed using a cut-off of p value < 0.05 after adjusting for multiple testing. The color of the nodes in the outer circle indicate the lipid species that had higher and lower abundance in the HCA2 group compared to the HC group. The gradient color varies with the p value for each enriched lipid class. Network plot (B) showing the correlation between the 40 differentially abundant lipid species. The color of the edges indicate positive (blue) or negative correlation. A particular lipid class is color coded and only the links with correlation coefficient greater than 0.75 or less than 0.75 and p value of < 0.05 are shown in the network.

Acknowledgments
This image is the copyrighted work of the attributed author or publisher, and ZFIN has permission only to display this image to its users. Additional permissions should be obtained from the applicable author or publisher of the image. Full text @ Front Nutr