FIGURE SUMMARY
Title

Generation and Characterization of a Zebrafish Model for ADGRV1-Associated Retinal Dysfunction Using CRISPR/Cas9 Genome Editing Technology

Authors
Stemerdink, M., Broekman, S., Peters, T., Kremer, H., de Vrieze, E., van Wijk, E.
Source
Full text @ Cells

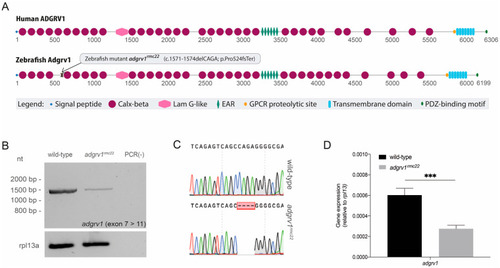
Domain architecture of human and zebrafish ADGRV1 and transcript analysis in homozygous adgrv1rmc22 mutant zebrafish. (A): Schematic representation of human and zebrafish ADGRV1 protein domain structure. Both proteins have a similar repetitive protein domain architecture. Calx-beta: Ca2+-binding calcium exchanger beta domain; Lam G-like: thrombospondin/pentraxin/laminin G-like domain; EAR: epilepsy-associated repeats; GPCR: G protein-coupled receptor; PDZ: post-synaptic density 95, Discs large, Zonula occludens-1 binding motif. (B): RT-PCR analyses of adgrv1 transcripts derived from homozygous adgrv1rmc22 zebrafish larvae (5 dpf) and wild-type siblings revealed a reduction in mutant adgrv1 transcripts when compared to wild-type adgrv1 transcripts. (C): Sanger sequencing confirmed the four-base-pair deletion in the amplicon derived from homozygous adgrv1rmc22 larvae. (D): RT-qPCR analysis of adgrv1 transcripts in wild-type and adgrv1rmc22 zebrafish larvae (5 dpf). Four pools of five larvae per genotype were used in RT-qPCR analysis. *** indicates p = 0.0001 (two-tailed unpaired Student’s t-test).

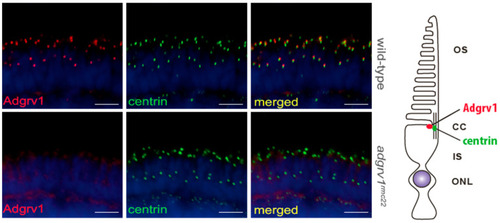
Localization of Adgrv1 in retinal cryosections of wild-type and adgrv1rmc22 zebrafish. Retinal cryosections of wild-type and adgrv1rmc22 zebrafish larvae (5 dpf) labeled with antibodies directed against Adgrv1 (red) and centrin (green) (as shown by the schematic representation on the right). Nuclei are counterstained with DAPI (blue). In wild-type larvae, Adgrv1 was detected adjacent to the connecting cilium marker centrin, whereas in adgrv1rmc22 zebrafish no Adgrv1 signal could be detected at this location. Scale bar: 10 μm. OS: outer segment; CC: connecting cilium; IS: inner segment; ONL: outer nuclear layer.

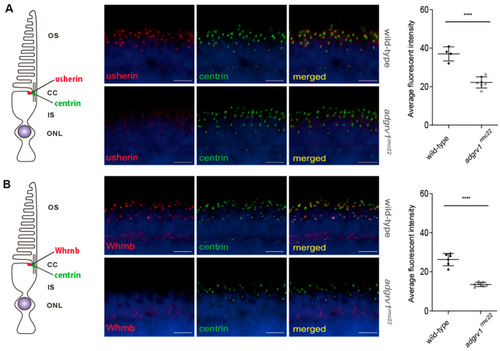
Reduced expression of usherin and Whrnb at the photoreceptor periciliary region of adgrv1rmc22 zebrafish larvae. Retinal cryosections of wild-type and adgrv1rmc22 zebrafish larvae (5 dpf) stained with antibodies directed against usherin (red) (A) or Whrnb (red) (B) and centrin (green). Nuclei are counterstained with DAPI (blue). (A): In wild-type larvae, usherin was present at the photoreceptor periciliary region in close proximity to the connecting cilium marker centrin. The intensity of the usherin signal in adgrv1rmc22 retinal sections was significantly reduced when compared to wild-types (n = 7 adgrv1rmc22 mutant larvae and n = 4 wild-type larvae). (B): In wild-type larvae, Whrnb was present at the photoreceptor periciliary region in close proximity to the connecting cilium marker centrin. The intensity of the Whrnb signal in adgrv1rmc22 retinal sections was significantly reduced when compared to wild-types (n = 7 adgrv1rmc22 mutant larvae and n = 6 wild-type larvae). Intensities of fluorescence signals were quantified (mean ± SD) and plotted in a scatter plot next to the corresponding pictures. **** indicates p < 0.0001 (two-tailed unpaired Student’s t-test). Scale bar: 10 μm.

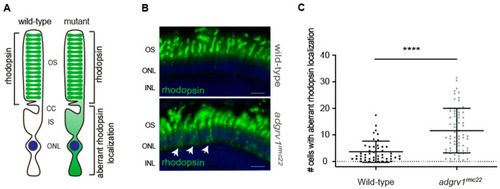
Aberrant localization of rhodopsin in photoreceptor cell bodies in the adgrv1rmc22 zebrafish. (A): Schematic representation of a photoreceptor with rhodopsin localization in the outer segments (OS) versus aberrant rhodopsin localization in the photoreceptor cell body as observed in adgrv1rmc22 mutants. (B): Retinal cryosections of wild-type and adgrv1rmc22 zebrafish larvae (6 dpf) labeled with antibodies directed against rhodopsin (green). Nuclei are counterstained with DAPI (blue). A significantly higher number of photoreceptors with aberrant localization of rhodopsin was observed in adgrv1rmc22 larvae (indicated with the white arrows) than in wild-type larvae. (C): Total number of cells with aberrant rhodopsin localization per retinal section were plotted, with mean ± SD (n = 29 adgrv1rmc22 mutant larvae and n = 21 wild-type larvae). A two-tailed unpaired Student’s t-test revealed a significant difference between adgrv1rmc22 mutants and wild-types. **** indicates p < 0.0001, scale bar: 10 μm. CC: connecting cilium; IS: inner segment; ONL: outer nuclear layer; INL: inner nuclear layer.

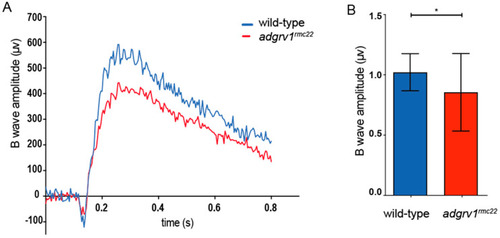
Electroretinogram recordings reveal impaired retinal function in adgrv1rmc22 juveniles. (A): Representative ERG traces of an adgrv1rmc22 and a wild-type zebrafish. (B): The adgrv1rmc22 zebrafish show a significant decrease in maximum B-wave amplitude when compared to wild-type zebrafish (* p < 0.01, two-tailed unpaired Student’s t-test). ERG traces were recorded on the eyes of juvenile zebrafish (n = 35 adgrv1rmc22 mutants and n = 31 wild-types, 6–8 weeks post fertilization). The average wild-type B-wave amplitude was normalized to 1. Mean B-wave amplitude ± SD is plotted in the bar graph.

Acknowledgments
This image is the copyrighted work of the attributed author or publisher, and ZFIN has permission only to display this image to its users. Additional permissions should be obtained from the applicable author or publisher of the image. Full text @ Cells