IMAGE

Figure 5

ID
ZDB-IMAGE-230630-32
Source
Figures for Stemerdink et al., 2023
Image
Figure Caption

Figure 5

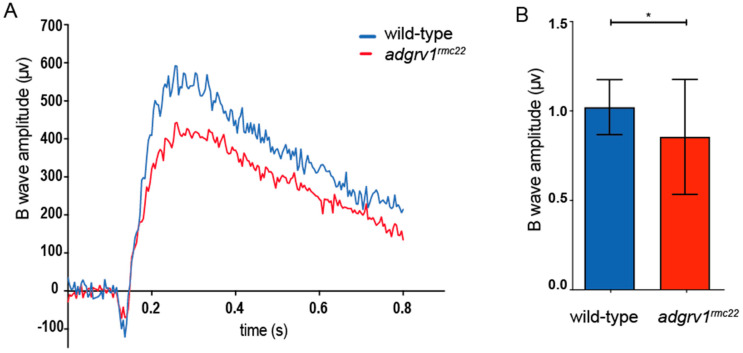
Electroretinogram recordings reveal impaired retinal function in adgrv1rmc22 juveniles. (A): Representative ERG traces of an adgrv1rmc22 and a wild-type zebrafish. (B): The adgrv1rmc22 zebrafish show a significant decrease in maximum B-wave amplitude when compared to wild-type zebrafish (* p < 0.01, two-tailed unpaired Student’s t-test). ERG traces were recorded on the eyes of juvenile zebrafish (n = 35 adgrv1rmc22 mutants and n = 31 wild-types, 6–8 weeks post fertilization). The average wild-type B-wave amplitude was normalized to 1. Mean B-wave amplitude ± SD is plotted in the bar graph.

Acknowledgments
This image is the copyrighted work of the attributed author or publisher, and ZFIN has permission only to display this image to its users. Additional permissions should be obtained from the applicable author or publisher of the image. Full text @ Cells