
- Title
-
Cell differentiation and matrix organization are differentially affected during bone formation in osteogenesis imperfecta zebrafish models with different genetic defects impacting collagen type I structure
- Authors
- Daponte, V., Tonelli, F., Masiero, C., Syx, D., Exbrayat-Héritier, C., Biggiogera, M., Willaert, A., Rossi, A., Coucke, P.J., Ruggiero, F., Forlino, A.
- Source
- Full text @ Matrix Biol.
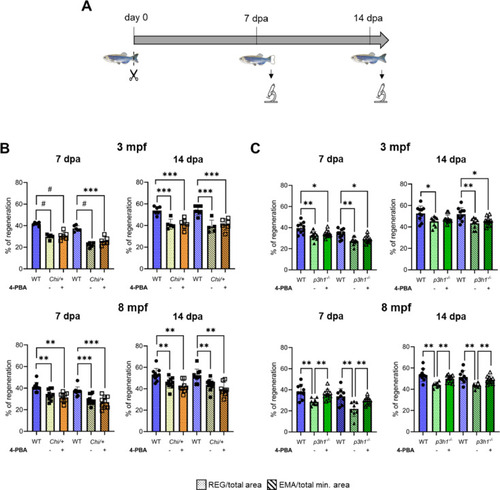
Caudal fin regeneration is reduced in Chi/+ and p3h1−/− compared to WT and is rescued by 4-PBA administration only in p3h1−/−. (A) Caudal fin was amputated and calcein vital staining was performed at 7 and 14 dpa, as shown in the scheme. (B) Caudal fin regeneration of WT and Chi/+ siblings. Chi/+ zebrafish at 3 and 8 mpf exhibited a significantly reduced caudal fin regeneration compared to WT both at 7 and 14 dpa. 4-PBA treatments did not improve either REG or EMA between controls and treated zebrafish at all ages and time points analyzed (3 mpf: WT n = 6, Chi/+ controls n = 5, treated Chi/+ n = 6; 8 mpf: WT n = 10, Chi/+ controls n = 10, treated Chi/+ n = 8). (C) Caudal fin regeneration of WT and p3h1−/− siblings. p3h1−/− mutants at 3 and 8 mpf showed a significantly reduced caudal fin regeneration compared to WT. 4-PBA administration significantly increased REG and EMA parameters in 8 mpf treated respect to controls, reaching WT value (3 mpf: WT n = 10, p3h1−/− controls n ≥ 9, treated p3h1−/− n = 10; 8 mpf: WT n = 9, p3h1−/− controls n ≥ 7, treated p3h1−/− n = 10). dpa: days post amputation; mpf: months post fertilization; REG: Regenerated Area; EMA: Estimated Mineralized Area. Each dot represents a single value: circle for WT, full square for Chi/+ controls, empty square for treated Chi/+, full triangle for p3h1−/− controls and empty triangle for treated p3h1−/−. * P < 0.05, ** P < 0.01, *** P < 0.001, # P < 0.0001. |
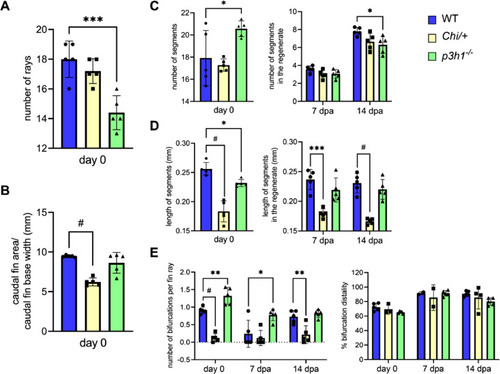
Morphometric analysis of WT, Chi/+ and p3h1−/− caudal fin before and during regeneration. Number and length of segments were measured in the total caudal fin at day 0 and only in the regenerated fin at 7 and 14 dpa. (A) A general reduction in the number of rays was detected in p3h1−/− compared to WT. (B) Caudal fin area, normalized to the fin base width, was significantly reduced in Chi/+ respect to WT. (C) At day 0 the number of segments, increased in p3h1−/− with respect to WT, was reduced in the 14 dpa regenerate, compatibly with overall reduced bone formation. (D) The medium length of segments was reduced in p3h1−/− respect to WT at day 0 and in Chi/+ respect to WT before and during regeneration. (E) p3h1−/− zebrafish presented an increased number of bifurcations at day 0 and 7 dpa, while Chi/+ rays had significantly less bifurcations at day 0 and at 14 dpa respect to WT. No differences were found in the bifurcation distality percentage, measured as the ratio between the distance to the first bifurcation and the fin ray length, between all zebrafish (n = 5 for each genotype). dpa: days post amputation. Each dot represents a single value: circle for WT, square for Chi/+ and triangle for p3h1−/−. * P < 0.05, ** P < 0.01, *** P < 0.001, # P < 0.0001. |
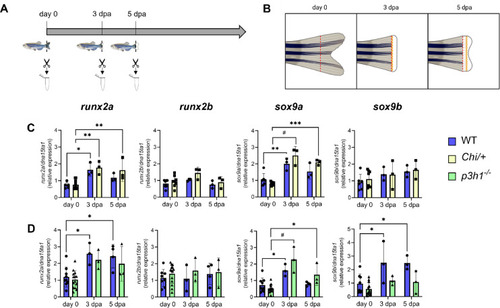
Sample collection and gene expression analysis of the early differentiation markers runx2a, runx2b, sox9a and sox9b in WT and mutants. (A) RNA was collected from pools of six caudal fins at day 0, 3 and 5 dpa as shown in the scheme. (B) Detailed schematic view of collected caudal fin samples. Day 0 refers to the portion of the caudal fin obtained after the first amputation at basal state; 3 dpa and 5 dpa regenerates were collected above the amputation plane. Created with BioRender.com. (C) RT-qPCR analysis in WT and Chi/+ zebrafish. runx2a and sox9a showed a significant increase after amputation, with no difference among genotypes. (D) RT-qPCR analysis in WT and p3h1−/− revealed the same trend observed in the previous group. n ≥ 3 pools of caudal fins for each genotype. dpa: days post amputation. Each dot represents a single value: circle for WT, square for Chi/+ and triangle for p3h1−/−. * P < 0.05, ** P < 0.01, *** P < 0.001, # P < 0.0001. |
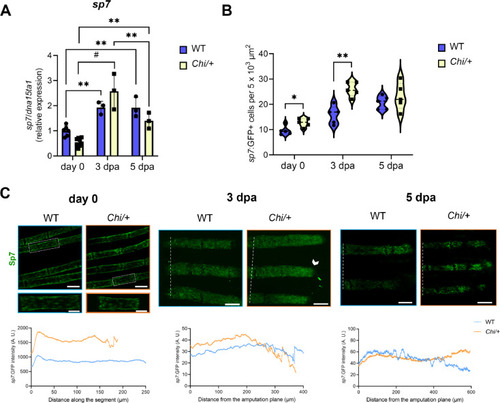
sp7 expression analysis in Chi/+ and WT caudal fins. (A) RT-qPCR analysis showed increased expression of sp7 at 3 dpa and decreased level at 5 dpa in both WT and mutant. No differences in sp7 expression between genotypes (n ≥ 3 pools of six caudal fins for each genotype) were detected. dpa: days post amputation. (B) sp7:GFP+ cells were increased in number at day 0 and 3 dpa in Chi/+ respect to WT (n = 5 zebrafish for each genotype). (C) Representative images of sp7:GFP localization in the fin rays of WT and Chi/+ at day 0, 3 and 5 dpa. For each time point is indicated the corresponding distribution analysis (GFP distribution along the segment at day 0, and from the amputation plane at 3 and 5 dpa). No significant differences were found between WT and Chi/+, but an accumulation of sp7:GFP+ cells could be observed at the tip of the fin rays at 3 dpa (arrowhead). The amputation plane is indicated by the white dotted line. Scale bar: 100 µm. In the graphs, each dot represents a single value: circle for WT and square for Chi/+. * P < 0.05, ** P < 0.01, # P < 0.0001. |
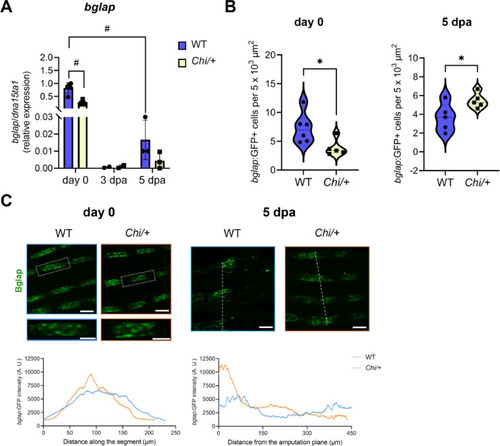
bglap expression analysis in Chi/+ caudal fins. (A) RT-qPCR analysis revealed a reduction in bglap expression in Chi/+ respect to WT at day 0 (n ≥ 3 pools of six caudal fins for each genotype). For 3 dpa bglap expression, 2 pools were used due to low expression level. dpa: days post amputation. (B) The number of bglap:GFP+ cells was decreased at day 0 and increased at 5 dpa in Chi/+ respect to WT (n ≥ 5 zebrafish for each genotype). (C) Representative images of bglap:GFP localization in the fin rays of WT and Chi/+ at day 0 and 5 dpa. For each time point is indicated the corresponding distribution analysis (GFP distribution along the segment at day 0, and from the amputation plane at 5 dpa). At day 0, bglap:GFP+ cells accumulated in the middle of the segment in Chi/+. At 5 dpa, a peak of bglap:GFP+ cells in Chi/+ respect to WT, was detected at the level of the amputation plane. The amputation plane is indicated by the white dotted line. In the graphs, each dot represents a single value: circle for WT and square for Chi/+. Scale bar: 100 µm. * P < 0.05, ** P < 0.01, # P < 0.0001. |
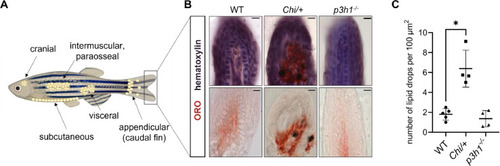
Adipocytic differentiation in the distal extremity of the caudal fin. (A) Representative images of adipocyte localization in zebrafish. Adipocytes can be found in the cranium, in the viscera, and in the subcutaneous, intermuscular and paraosseal tissues. Appendicular adipocytes were also described in the caudal fin base; vice versa, in the distal extremity of the caudal fin, few or no adipocytes should be present. Created with BioRender.com. (B) Oil Red O (ORO) and hematoxylin counterstaining of WT (n = 5), Chi/+ (n = 4) and p3h1−/− (n = 4) longitudinal caudal fin sections. Double staining on the top, ORO staining on the bottom. Scale bar: 10 µm. (C) Quantification of the number of ORO-stained lipid drops in the distal caudal fin revealed an increased adipogenesis in Chi/+ zebrafish. Each dot represents a single value: circle for WT, square for Chi/+ and triangle for p3h1−/−. * P < 0.05. |
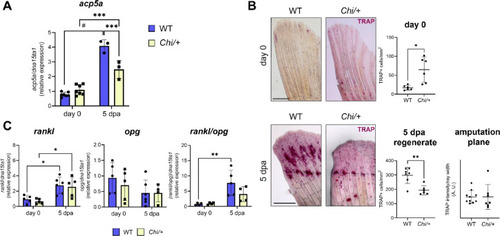
Osteoclast expression and activity in Chi/+. (A) RT-qPCR analysis of acp5a expression at day 0 and 5 dpa revealed a reduced transcript expression in Chi/+ at 5 dpa (n ≥ 3 pools of six caudal fins for each genotype). (B) TRAP staining of WT and Chi/+ caudal fin samples collected at day 0 and at 5 dpa (the amputation site is indicated by the black dotted line). Osteoclast activity was increased at day 0 and reduced at 5 dpa in mutants respect to WT (n ≥ 6 caudal fins for each genotype, as indicated by the dots). Scale bar: 500 µm. (C) RT-qPCR analysis of rankl, opg and rankl/opg ratio. No significant differences were detected between genotypes (n ≥ 4 pools of six caudal fins for each genotype). dpa: days post amputation. In the graphs, each dot represents a single value: circle for WT and square for Chi/+. * P < 0.05, ** P < 0.01, *** P < 0.001, # P < 0.0001. |
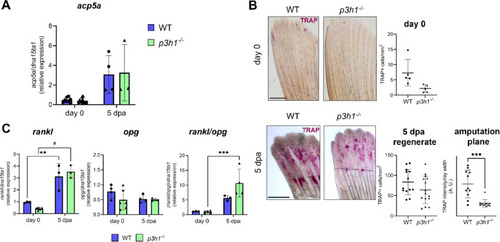
Osteoclast expression and activity in p3h1−/−. (A) RT-qPCR analysis of acp5a expression at day 0 and 5 dpa showed no differences between genotypes (n ≥ 3 pools of six caudal fins for each genotype). (B) TRAP staining of WT and p3h1−/− caudal fin samples collected at day 0 and at 5 dpa (the amputation site is indicated by the black dotted line). While osteoclast activity of p3h1−/− zebrafish was normal at day 0 and in the 5 dpa regenerate, it significantly decreased in the 5 dpa amputation plane with respect to WT (n ≥ 5 caudal fins for each genotype, as indicated by the dots). Scale bar: 500 µm. (C) RT-qPCR analysis of rankl, opg and rankl/opg ratio. No significant differences were detected between genotypes (n ≥ 3 pools of six caudal fins for each genotype). dpa: days post amputation. In the graphs, each dot represents a single value: circle for WT and triangle for p3h1−/−. * P < 0.05, ** P < 0.01, *** P < 0.001. |
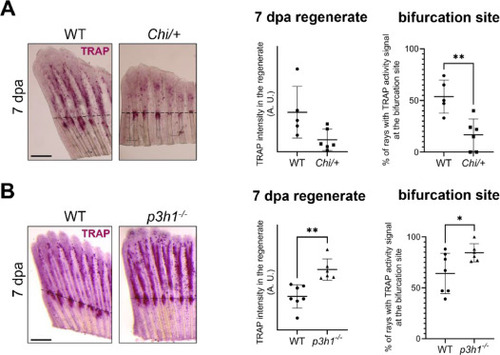
Osteoclast activity in the regenerate and at the bifurcation site at 7 dpa in WT, Chi/+ and p3h1−/−. (A) TRAP staining of WT and Chi/+ caudal fin samples collected at 7 dpa (the amputation site is indicated by the black dotted line). While total TRAP activity in the regenerate was unchanged between WT and Chi/+, TRAP signal at the bifurcation site was significantly reduced in Chi/+ respect to WT (n ≥ 5 caudal fins for each genotype, as indicated by the dots). Scale bar: 500 µm. (B) TRAP staining of WT and p3h1−/− caudal fin samples collected at 7 dpa (the amputation site is indicated by the black dotted line). TRAP activity was significantly increased in p3h1−/− with respect to WT at this time point, with strong TRAP signal detected at the level of the bifurcations (n ≥ 6 caudal fins for each genotype, as indicated by the dots). Scale bar: 500 µm. * P < 0.05, ** P < 0.01. |
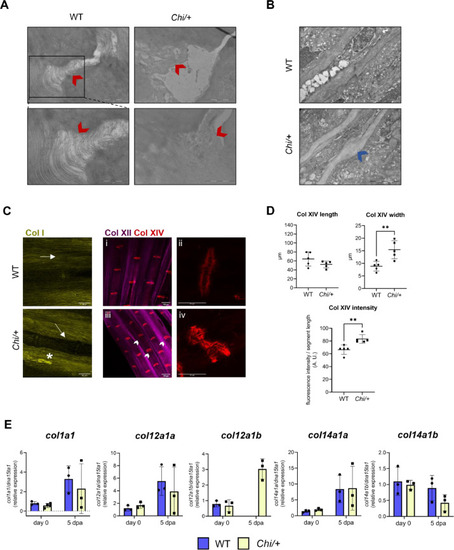
Collagen disorganization in the caudal fin of Chi/+ zebrafish. (A) TEM images of WT (n = 1) and Chi/+ (n = 3) collagen fibrils at the caudal fin joints. In the WT several parallel, well organized collagen fibrils connected the inter-joint surfaces. In the mutant, the joint structure appeared disrupted, with fibrils having different orientations and being scattered in the extracellular space, as indicated by the red arrowheads. Scale bar top: 2 µm. Scale bar bottom: 1 µm. (B) TEM images of WT (n = 2) and Chi/+ (n = 2) caudal fin rays. The presence of calli along Chi/+ fin rays was detected, as indicated by the blue arrowhead. Scale bar: 2 µm. (C) Representative immunofluorescence of collagen I, XII and XIV in WT and Chi/+ caudal fin. Collagen I fibrils were thick and parallel to the fin ray in WT (arrow). In Chi/+ they accumulated in proximity to the fin ray (arrow), in some cases forming aggregates (asterisk). Collagen XII was distributed widely in the caudal fin, similarly to collagen I. Collagen XIV specifically localized in the fin ray joints. In Chi/+, joints showed altered structure and increased inter-joint space, as indicated by the arrowheads (i: collagen XII and collagen XIV co-labeling in WT zebrafish; ii: 63X magnification of collagen XIV-labeled joint in WT zebrafish; iii: collagen XII and collagen XIV co-labeling in Chi/+ zebrafish; iv: 63X magnification of collagen XIV-labeled joint in Chi/+ zebrafish). (D) Collagen XIV analysis revealed increased joint width and fluorescence intensity in Chi/+ respect to WT (n = 5 for each genotype). (E) RT-qPCR analysis of collagens did not show differences between the two genotypes (n = 3 pools of six caudal fins for each genotype). dpa: days post amputation. In the graphs, each dot represents a single value: circle for WT and square for Chi/+. ** P < 0.01. |