
|
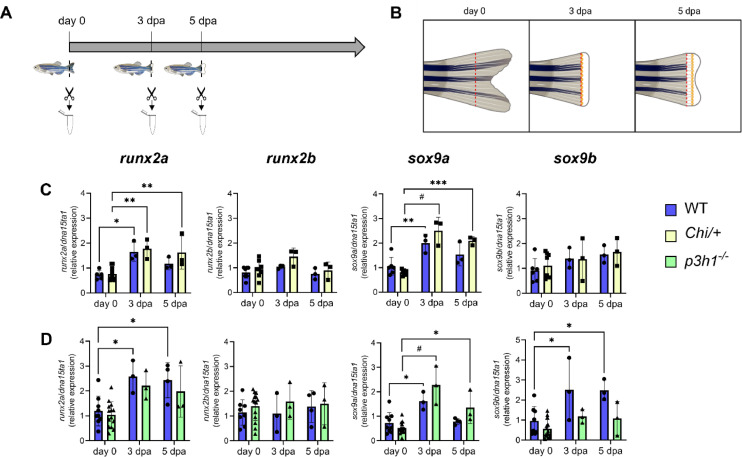
Fig. 3 Sample collection and gene expression analysis of the early differentiation markers runx2a, runx2b, sox9a and sox9b in WT and mutants. (A) RNA was collected from pools of six caudal fins at day 0, 3 and 5 dpa as shown in the scheme. (B) Detailed schematic view of collected caudal fin samples. Day 0 refers to the portion of the caudal fin obtained after the first amputation at basal state; 3 dpa and 5 dpa regenerates were collected above the amputation plane. Created with BioRender.com. (C) RT-qPCR analysis in WT and Chi/+ zebrafish. runx2a and sox9a showed a significant increase after amputation, with no difference among genotypes. (D) RT-qPCR analysis in WT and p3h1−/− revealed the same trend observed in the previous group. n ≥ 3 pools of caudal fins for each genotype. dpa: days post amputation. Each dot represents a single value: circle for WT, square for Chi/+ and triangle for p3h1−/−. * P < 0.05, ** P < 0.01, *** P < 0.001, # P < 0.0001.