
|
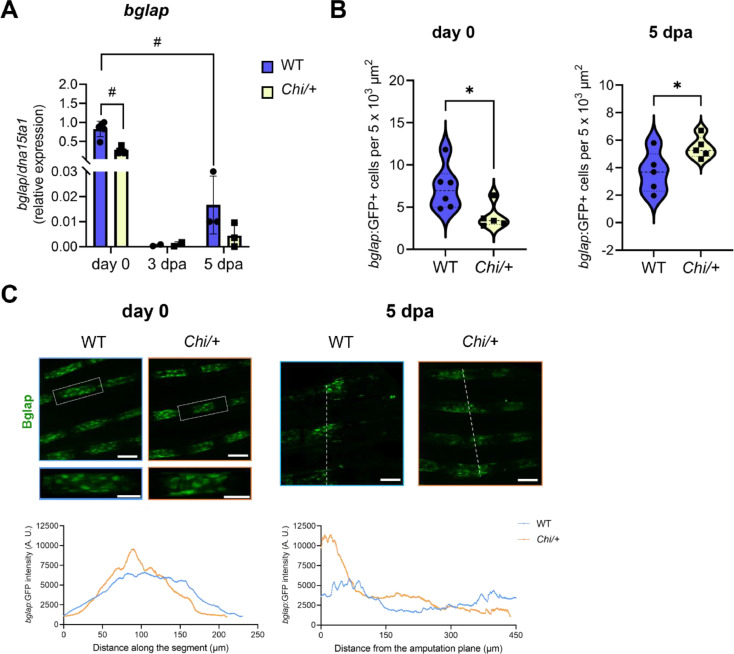
Fig. 5 bglap expression analysis in Chi/+ caudal fins. (A) RT-qPCR analysis revealed a reduction in bglap expression in Chi/+ respect to WT at day 0 (n ≥ 3 pools of six caudal fins for each genotype). For 3 dpa bglap expression, 2 pools were used due to low expression level. dpa: days post amputation. (B) The number of bglap:GFP+ cells was decreased at day 0 and increased at 5 dpa in Chi/+ respect to WT (n ≥ 5 zebrafish for each genotype). (C) Representative images of bglap:GFP localization in the fin rays of WT and Chi/+ at day 0 and 5 dpa. For each time point is indicated the corresponding distribution analysis (GFP distribution along the segment at day 0, and from the amputation plane at 5 dpa). At day 0, bglap:GFP+ cells accumulated in the middle of the segment in Chi/+. At 5 dpa, a peak of bglap:GFP+ cells in Chi/+ respect to WT, was detected at the level of the amputation plane. The amputation plane is indicated by the white dotted line. In the graphs, each dot represents a single value: circle for WT and square for Chi/+. Scale bar: 100 µm. * P < 0.05, ** P < 0.01, # P < 0.0001.