
|
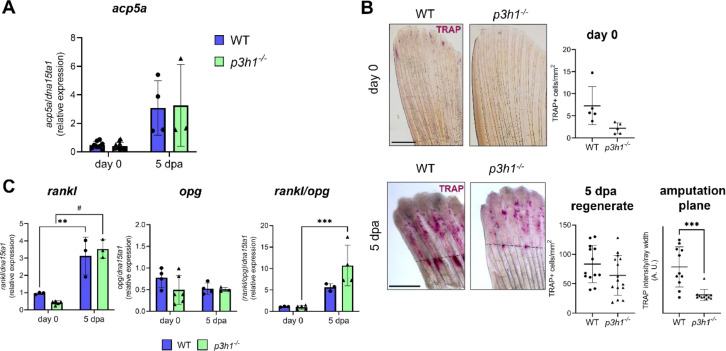
Fig. 8 Osteoclast expression and activity in p3h1−/−. (A) RT-qPCR analysis of acp5a expression at day 0 and 5 dpa showed no differences between genotypes (n ≥ 3 pools of six caudal fins for each genotype). (B) TRAP staining of WT and p3h1−/− caudal fin samples collected at day 0 and at 5 dpa (the amputation site is indicated by the black dotted line). While osteoclast activity of p3h1−/− zebrafish was normal at day 0 and in the 5 dpa regenerate, it significantly decreased in the 5 dpa amputation plane with respect to WT (n ≥ 5 caudal fins for each genotype, as indicated by the dots). Scale bar: 500 µm. (C) RT-qPCR analysis of rankl, opg and rankl/opg ratio. No significant differences were detected between genotypes (n ≥ 3 pools of six caudal fins for each genotype). dpa: days post amputation. In the graphs, each dot represents a single value: circle for WT and triangle for p3h1−/−. * P < 0.05, ** P < 0.01, *** P < 0.001.