
- Title
-
atm Mutation and Oxidative Stress Enhance the Pre-Cancerous Effects of UHRF1 Overexpression in Zebrafish Livers
- Authors
- Ajouaou, Y., Magnani, E., Madakashira, B., Jenkins, E., Sadler, K.C.
- Source
- Full text @ Cancers
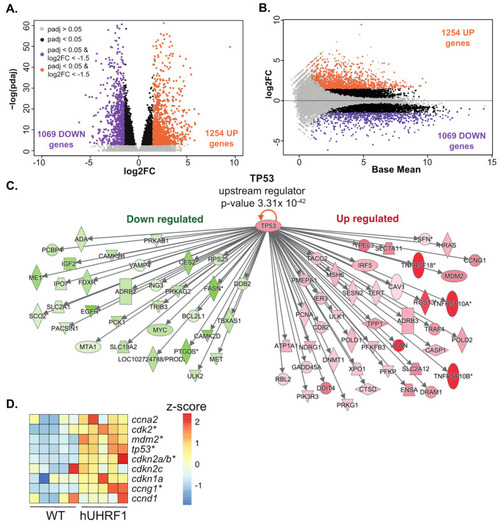
hUHRF1 overexpression in zebrafish hepatocytes activates Tp53. Bulk RNAseq analysis of 5 pools of livers collected from hUHRF1 larvae normalized to WT siblings on 5 dpf. (A) Volcano plot and (B) MA plot showing log2 fold change and log2 p-value adjusted of hUHRF1 overexpressing livers compared to WT siblings. Genes with p-value adjusted greater than 0.05 are shown in grey, significant DEGs (p-value adjusted smaller than 0.05) are in black, upregulated DEGs (p-value adjusted smaller than 0.05 and log2 fold change greater than 1.5) are in purple and downregulated DEGs (p-value adjusted smaller than 0.05 and log2 fold change smaller than −1.5) are in orange. (C) IPA analysis identified tp53 as a top upstream regulator of the transcriptomic changes in hUHRF1 livers (p-value 3.31 × 10−42). Direct TP53 target genes predicted to be downregulated following Tp53 activation and that are downregulated in hUHRF1 overexpressing livers dataset are shown in green, and direct targets are predicted to be upregulated following TP53 activation and that are upregulated in hUHRF1 overexpressing livers. (D) Heatmap of the expression of TP53 direct target genes in hUHRF1 overexpressing livers compared to WT siblings at 5 dpf. Z-score is calculated on raw counts of each biological replicate. * indicates genes that have an adjusted p-value < 0.05. |
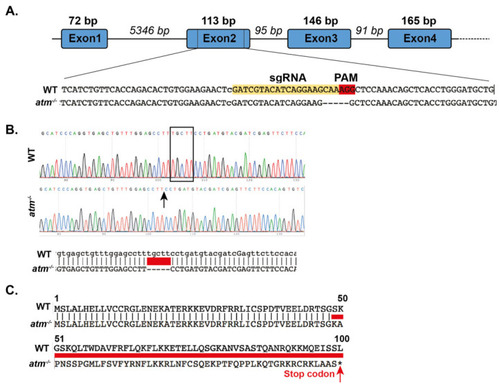
Figure 2. atm−/− mutant zebrafish generated by CRISPR-Cas9. (A) Schematic representation of the atm gene from exon 1 to exon 4. Wild type and atm−/− genomic sequences and predicted amino acid sequence of atm mutant alleles are shown. The sgRNA used to generate the mutant is shown in yellow, and the PAM sequence is in red. (B) Sanger sequencing and alignment of cDNA obtained from 2–5 dpf WT and atm−/− mutants confirms the 5 bp deletion at the mRNA level. In red the deleted sequence. (C) Alignment between the predicted amino acid sequence of WT and atm mutant alleles. The amino acids predicted to be generated by atm−/− mutants are indicated by the red line.
|
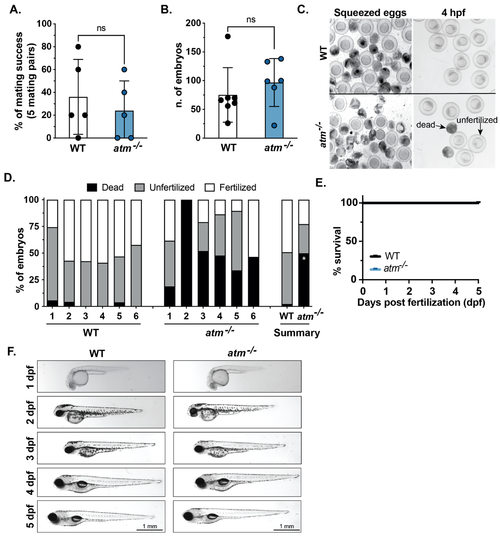
Figure 3. atm mutation is well tolerated in zebrafish embryos. (A) The percentage of mating success calculated from 5 individual pairs over 6 independent matings for WT and atm−/− mutants. Each dot indicates the average success of each mating pair based on the production of any embryos. (B) The number of embryos generated for paired mating of WT and atm−/− adults. Each dot indicated a different mating. (C) Images of WT and atm−/− mutants after squeezing and at 4 h post-fertilization (hpf) showing fertilized, unfertilized and dead embryos. (D) Stack bar indicates dead, fertilized, and unfertilized as categorized in panel C for individual mating pairs of WT and atm−/− mutants. Summary stack bars show the average of each phenotype for WT and atm−/− mutants. (E) Survival curve of WT and atm−/− mutants from 1 to 5 dpf indicates no significant differences between fertilized embryos of WT and atm−/− mutants. (F) Representative images of live WT and atm−/− mutants from 1 to 5 dpf show no observable morphological differences are detected. Values are expressed as the mean ± SD and were compared by unpaired t-test. Significant differences are indicated as follows: ns p > 0.05 (non-significant), * p < 0.05.
|
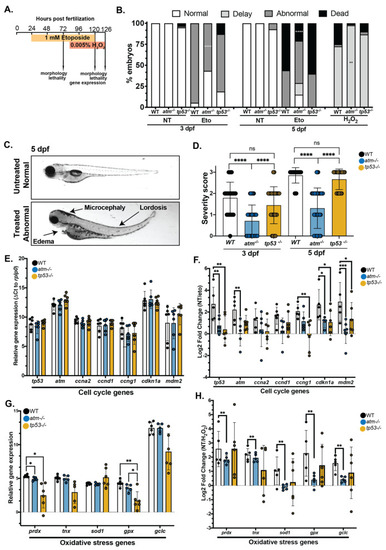
Figure 4. atm mutation suppresses the toxic response to etoposide or H2O2 exposure (A) Treatment scheme for exposure to etoposide and H2O2. (B) The percent of WT, atm−/− and tp53−/− embryos that have morphological defects or lethality in response to etoposide or H2O2. The experiments were performed on 6–8 clutches for each genotype and with 10 larvae per clutch (total 60 larvae). (C) Representative images of etoposide treated and untreated larvae at 5 dpf illustrating different phenotypes induced by etoposide treatment. Arrows indicate the phenotypes used to assign a severity score. (D) The phenotype severity score of etoposide treated larvae at 3 and 5 dpf in WT, atm−/− and tp53−/− larvae. The severity score for all untreated larvae for all genotypes was zero. The experiment was performed on 6 independent biological replicates for each genotype. Each dot represents 1 larva. (E) qPCR analysis of tp53 target genes normalized to rplp0 expression in untreated 3 dpf larvae. There are no significant differences between samples. (F) The log2 fold change of WT, atm−/− and tp53−/− 3 dpf embryos treated with etoposide compared to untreated embryos of the same genotype. The experiment was performed on 4–6 independent biological replicates for each genotype, with each dot representing values in a single clutch. (G) qPCR analysis of oxidative stress genes normalized to rplp0 expression in untreated 5 dpf larvae. (H) The log2 fold change of WT, atm−/− and tp53−/− 5 dpf embryos treated with H2O2 compared to untreated embryos of the same genotype. The experiment was performed on pools of larvae from 5–6 independent clutches for each genotype, with each dot representing values in a single clutch. Values are expressed as the mean ± SD and were compared by two-way ANOVA with Tukey’s multiple comparisons test (B,E–H) or one-way ANOVA with Tukey’s multiple comparisons test (D). Only significant differences are indicated as follows: * p < 0.05, ** p < 0.01, *** p < 0.001, **** p < 0.0001.
|
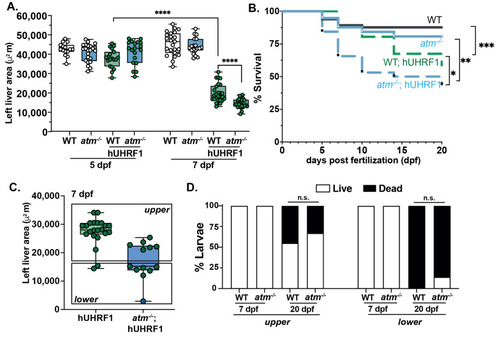
Figure 5. atm mutation enhanced the small liver phenotype and larval death in Tg (fabp10a:hUHRF1-EGFP) larvae. (A) Liver size of hUHRF1 and atm−/−; hUHRF1 larvae compared to non-transgenic WT and atm−/− siblings at 5 and 7 dpf shows that atm mutation synergizes with hUHRF1 overexpression to decrease in liver size by 7 dpf. Experiments was performed in 2 biological replicates; each dot represents 1 liver. The middle line in the box plot represents the median, with the whiskers representing the range of the values for each condition. B. Survival curve of WT, atm−/−, hUHRF1 and atm−/−; hUHRF1 larvae from 5 to 20 dpf. (C,D) hUHRF1 with WT atm and atm−/−;hUHRF1 larvae were separated into 2 groups at 7 dpf based the liver size being above or below the median of the size measured in atm−/−; hUHRF1 larvae. Dots indicate number of livers and were assessed for survival at 7 and 20 dpf (D). Values are expressed as the mean ± SD and were compared by unpaired t-test (A,C,D) or by long-rank test (B). Significant differences are indicated as follows: n.s. indicates p > 0.05 (non-significant), * p < 0.05, ** p < 0.01, *** p < 0.001, **** p < 0.0001 as determined by a 2-way ANOVA.
|
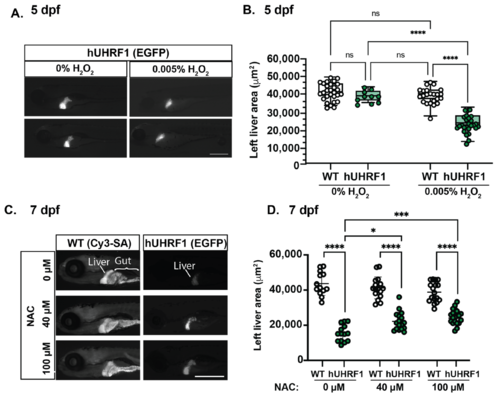
Figure 6. The small liver phenotype caused by hUHRF1 overexpression is enhanced by H2O2 exposure and reversed by NAC treatment. (A) hUHRF1 transgenic larvae and their non-transgenic siblings were untreated or treated with 0.005% H2O2 for 40–42 h and collected at 120 hpf. The left liver area was measured using the EGFP fluorescence (hUHRF1 transgenics) or CY3-SA staining (WT). (B) Left liver lobe area is significantly smaller in hUHRF1 larvae treated with 0.005% H2O2 compared to non-transgenic siblings treated with H2O2 and compared to untreated hUHRF1 larvae. The median is indicated by the horizontal line in the box and the whiskers represent the range of measurements. (C) hUHRF1 transgenic larvae and their non-transgenic siblings were untreated or treated with 40 or 100 μM of NAC from 4 dpf to 7 dpf and imaged at 7 dpf for left liver area on EGFP fluorescence (transgenics) or CY3-SA staining (controls). (D) Liver size is significantly smaller in hUHRF1 larvae compared to non-transgenic siblings at 7 dpf and NAC treatment increases the size of the liver in transgenic larvae. Experiments were performed in 2–3 clutches with at least 9 animals per clutch. Each dot represents 1 liver. Scale bar: 500 µm. Values are expressed as the mean ± SD and were compared by two-way ANOVA with Tukey’s multiple comparisons test (B,D). Significant differences are indicated as follows: ns p > 0.05 (non-significant), * p < 0.05, *** p < 0.001, **** p < 0.0001.
|