
Image
|
Figure Caption
Figure 4
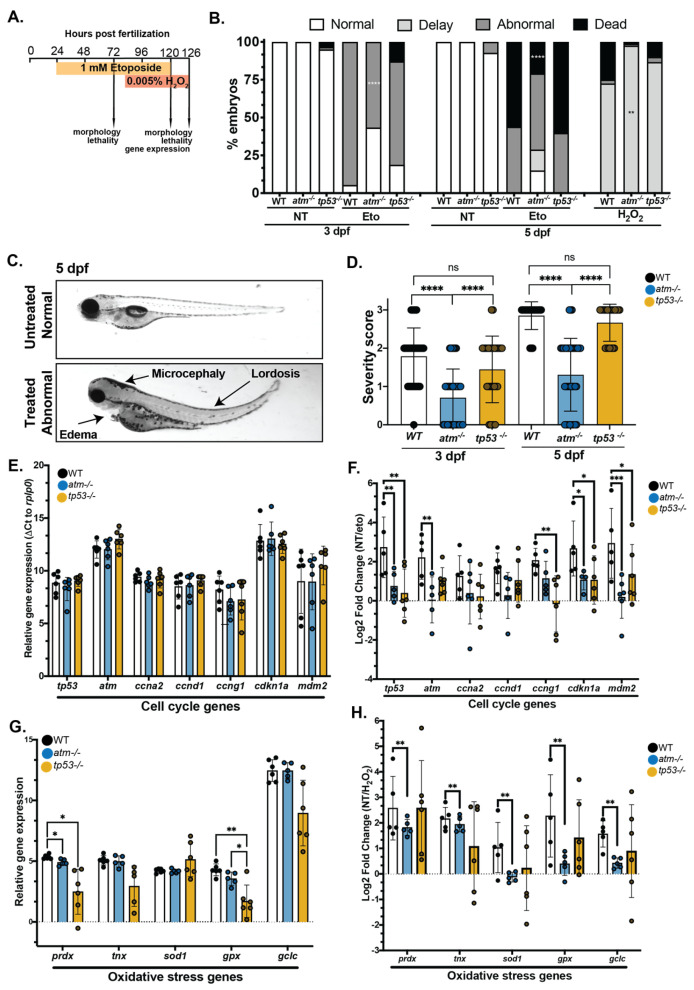
Figure 4. atm mutation suppresses the toxic response to etoposide or H2O2 exposure (A) Treatment scheme for exposure to etoposide and H2O2. (B) The percent of WT, atm−/− and tp53−/− embryos that have morphological defects or lethality in response to etoposide or H2O2. The experiments were performed on 6–8 clutches for each genotype and with 10 larvae per clutch (total 60 larvae). (C) Representative images of etoposide treated and untreated larvae at 5 dpf illustrating different phenotypes induced by etoposide treatment. Arrows indicate the phenotypes used to assign a severity score. (D) The phenotype severity score of etoposide treated larvae at 3 and 5 dpf in WT, atm−/− and tp53−/− larvae. The severity score for all untreated larvae for all genotypes was zero. The experiment was performed on 6 independent biological replicates for each genotype. Each dot represents 1 larva. (E) qPCR analysis of tp53 target genes normalized to rplp0 expression in untreated 3 dpf larvae. There are no significant differences between samples. (F) The log2 fold change of WT, atm−/− and tp53−/− 3 dpf embryos treated with etoposide compared to untreated embryos of the same genotype. The experiment was performed on 4–6 independent biological replicates for each genotype, with each dot representing values in a single clutch. (G) qPCR analysis of oxidative stress genes normalized to rplp0 expression in untreated 5 dpf larvae. (H) The log2 fold change of WT, atm−/− and tp53−/− 5 dpf embryos treated with H2O2 compared to untreated embryos of the same genotype. The experiment was performed on pools of larvae from 5–6 independent clutches for each genotype, with each dot representing values in a single clutch. Values are expressed as the mean ± SD and were compared by two-way ANOVA with Tukey’s multiple comparisons test (B,E–H) or one-way ANOVA with Tukey’s multiple comparisons test (D). Only significant differences are indicated as follows: * p < 0.05, ** p < 0.01, *** p < 0.001, **** p < 0.0001.
Acknowledgments
This image is the copyrighted work of the attributed author or publisher, and
ZFIN has permission only to display this image to its users.
Additional permissions should be obtained from the applicable author or publisher of the image.
Full text @ Cancers