
Figure 1
- ID
- ZDB-FIG-230518-90
- Publication
- Ajouaou et al., 2023 - atm Mutation and Oxidative Stress Enhance the Pre-Cancerous Effects of UHRF1 Overexpression in Zebrafish Livers
- Other Figures
- All Figure Page
- Back to All Figure Page
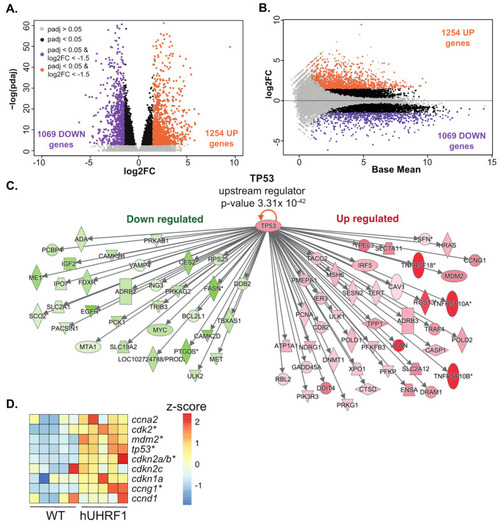
hUHRF1 overexpression in zebrafish hepatocytes activates Tp53. Bulk RNAseq analysis of 5 pools of livers collected from hUHRF1 larvae normalized to WT siblings on 5 dpf. (A) Volcano plot and (B) MA plot showing log2 fold change and log2 p-value adjusted of hUHRF1 overexpressing livers compared to WT siblings. Genes with p-value adjusted greater than 0.05 are shown in grey, significant DEGs (p-value adjusted smaller than 0.05) are in black, upregulated DEGs (p-value adjusted smaller than 0.05 and log2 fold change greater than 1.5) are in purple and downregulated DEGs (p-value adjusted smaller than 0.05 and log2 fold change smaller than −1.5) are in orange. (C) IPA analysis identified tp53 as a top upstream regulator of the transcriptomic changes in hUHRF1 livers (p-value 3.31 × 10−42). Direct TP53 target genes predicted to be downregulated following Tp53 activation and that are downregulated in hUHRF1 overexpressing livers dataset are shown in green, and direct targets are predicted to be upregulated following TP53 activation and that are upregulated in hUHRF1 overexpressing livers. (D) Heatmap of the expression of TP53 direct target genes in hUHRF1 overexpressing livers compared to WT siblings at 5 dpf. Z-score is calculated on raw counts of each biological replicate. * indicates genes that have an adjusted p-value < 0.05. |