
Image
|
Figure Caption
Figure 3
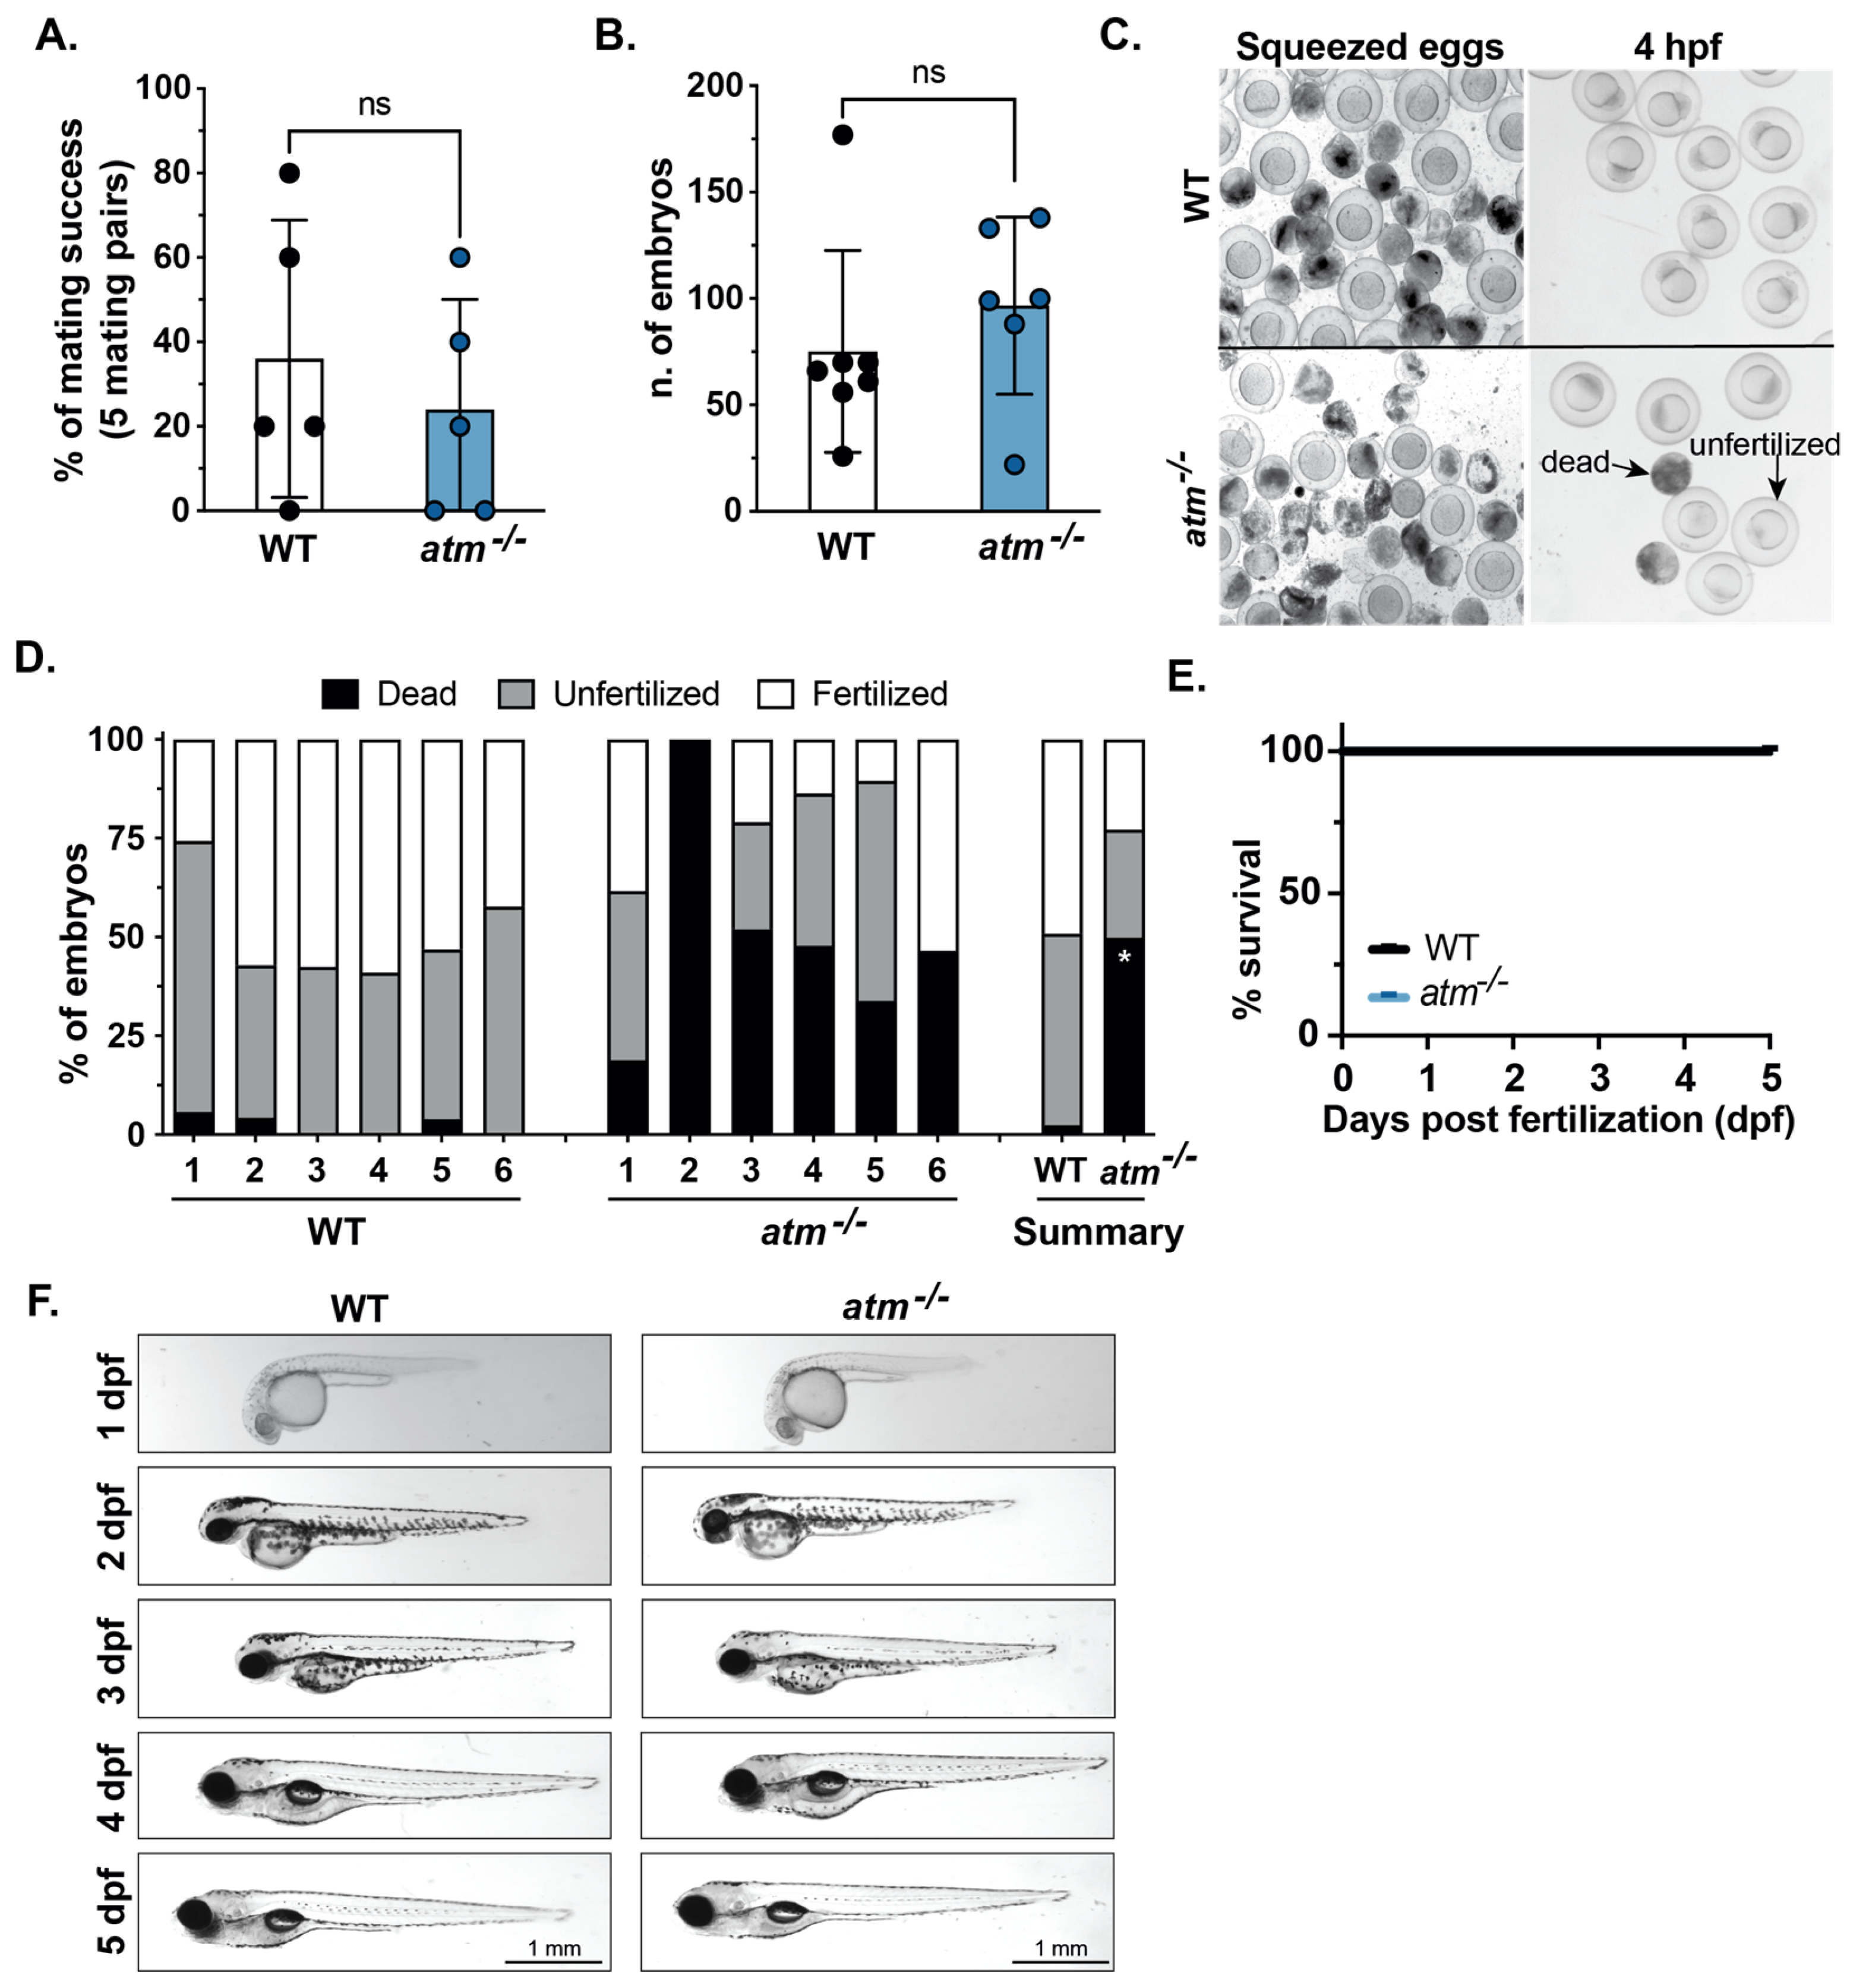
Figure 3. atm mutation is well tolerated in zebrafish embryos. (A) The percentage of mating success calculated from 5 individual pairs over 6 independent matings for WT and atm−/− mutants. Each dot indicates the average success of each mating pair based on the production of any embryos. (B) The number of embryos generated for paired mating of WT and atm−/− adults. Each dot indicated a different mating. (C) Images of WT and atm−/− mutants after squeezing and at 4 h post-fertilization (hpf) showing fertilized, unfertilized and dead embryos. (D) Stack bar indicates dead, fertilized, and unfertilized as categorized in panel C for individual mating pairs of WT and atm−/− mutants. Summary stack bars show the average of each phenotype for WT and atm−/− mutants. (E) Survival curve of WT and atm−/− mutants from 1 to 5 dpf indicates no significant differences between fertilized embryos of WT and atm−/− mutants. (F) Representative images of live WT and atm−/− mutants from 1 to 5 dpf show no observable morphological differences are detected. Values are expressed as the mean ± SD and were compared by unpaired t-test. Significant differences are indicated as follows: ns p > 0.05 (non-significant), * p < 0.05.
Acknowledgments
This image is the copyrighted work of the attributed author or publisher, and
ZFIN has permission only to display this image to its users.
Additional permissions should be obtained from the applicable author or publisher of the image.
Full text @ Cancers