
Image
|
Figure Caption
Figure 5
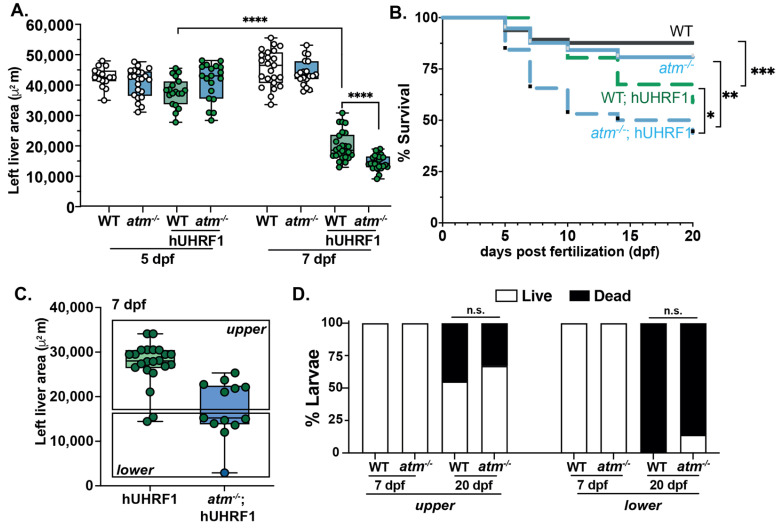
Figure 5. atm mutation enhanced the small liver phenotype and larval death in Tg (fabp10a:hUHRF1-EGFP) larvae. (A) Liver size of hUHRF1 and atm−/−; hUHRF1 larvae compared to non-transgenic WT and atm−/− siblings at 5 and 7 dpf shows that atm mutation synergizes with hUHRF1 overexpression to decrease in liver size by 7 dpf. Experiments was performed in 2 biological replicates; each dot represents 1 liver. The middle line in the box plot represents the median, with the whiskers representing the range of the values for each condition. B. Survival curve of WT, atm−/−, hUHRF1 and atm−/−; hUHRF1 larvae from 5 to 20 dpf. (C,D) hUHRF1 with WT atm and atm−/−;hUHRF1 larvae were separated into 2 groups at 7 dpf based the liver size being above or below the median of the size measured in atm−/−; hUHRF1 larvae. Dots indicate number of livers and were assessed for survival at 7 and 20 dpf (D). Values are expressed as the mean ± SD and were compared by unpaired t-test (A,C,D) or by long-rank test (B). Significant differences are indicated as follows: n.s. indicates p > 0.05 (non-significant), * p < 0.05, ** p < 0.01, *** p < 0.001, **** p < 0.0001 as determined by a 2-way ANOVA.
Acknowledgments
This image is the copyrighted work of the attributed author or publisher, and
ZFIN has permission only to display this image to its users.
Additional permissions should be obtained from the applicable author or publisher of the image.
Full text @ Cancers