
- Title
-
Epigenetic landscape reveals MECOM as an endothelial lineage regulator
- Authors
- Lv, J., Meng, S., Gu, Q., Zheng, R., Gao, X., Kim, J.D., Chen, M., Xia, B., Zuo, Y., Zhu, S., Zhao, D., Li, Y., Wang, G., Wang, X., Meng, Q., Cao, Q., Cooke, J.P., Fang, L., Chen, K., Zhang, L.
- Source
- Full text @ Nat. Commun.
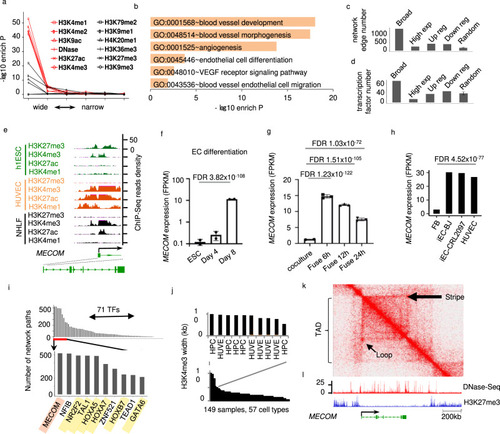
Epigenetic landscapes suggest MECOM as a lineage regulator for Endothelial cell (EC).
a Enrichment of EC identity regulators plotted against the width of enrichment peak for each chromatin mark. b Pathways enriched in EC putative identity regulators defined by broad enrichment of activating histone modifications. c Number of regulation network edges connected to and (d) Number of transcription factors in EC putative identity regulators or other gene groups, of which each has the same number of genes. e Signal density of individual chromatin marks at the MECOM locus in h1ESC, HUVEC and NHLF. f–h Expression level of MECOM at individual intervals during EC differentiation mESC (f), the formation of mESC-hEC heterokayon (g), and human fibroblast to EC transdifferentiation (h). i Number of gene regulation network paths connected by each transcription factor (TFs). MECOM is highlighted in red and known EC regulators are highlighted in yellow. Gene regulation network for EC was defined by algorithm and database of the software CellNet. j H3K4me3 peak width at MECOM locus in individual ChIP-Seq samples. Sample information is provided in Supplementary Data 4. k Two-dimensional heat map showing the chromosomal contact frequency in HUVEC around MECOM locus. l Signal density of DNase-Seq and H3K27me3 ChIP-Seq in HUVEC around MECOM locus. Broad: broad active histone modifications; High exp: high expression; Up reg or Down reg: up or downregulated in EC relative to ESC. Random: randomly selected genes. Data are presented as mean values ± SD (f, g). n = 2 biologically independent samples (f), n = 3 biologically independent samples (g). P values are determined by two-tailed Fisher Exact test implemented in R v4.0.2 (a), modified two-tailed Fisher Exact test implemented in DAVID v6.8 (b), two-tailed Negative Binomial test (f, g), and two-tailed Poisson test implemented in edgeR v3.14.0 (h). EC data were from HUVECs (See Supplementary Data 4). |
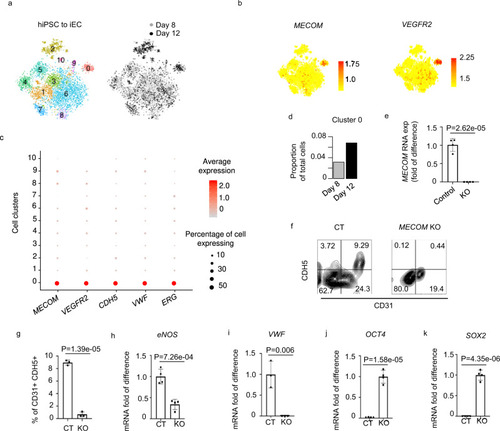
MECOM is required for EC differentiation from hiPSC.
a–d scRNA-seq analysis reveals MECOM as a molecular signature of iPSC-derived ECs. (a) T-SNE plot of combined cells from days 8 and 12 of EC differentiation. 11 cell clusters are defined based on transcriptomic similarity. b,c Expression profiles of MECOM and VEGFR2 across 11 individual clusters (b) compared with other known EC markers (CDH5, VWF, ERG) (c). d Proportion of cells assigned to the MECOM positive cluster 0 on day 8 and day 12. e–k Experimental verification of MECOM as a lineage factor required for EC lineage transition from iPSCs (e) Relative expression level of MECOM in MECOM KO sample. f FACS analysis of CD31+CDH5+ ECs. g Quantification of CD31+CDH5+ EC percentage. h–k Relative gene expression levels of eNOS (h), VWF (i), OCT4 (j), and SOX2 (k) in MECOM KO sample. Data are presented as mean values ± SD (e, g–k). n = 4 biologically independent samples (e–k), P values are determined by two-tailed Student’s t test. Source data are provided as a Source Data file. |
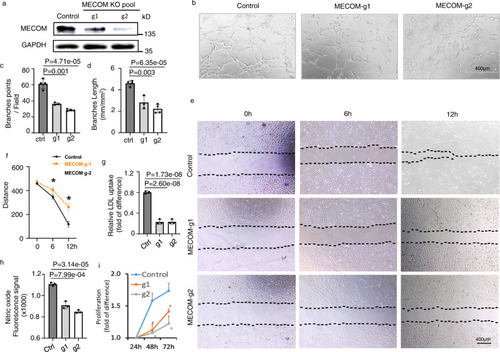
MECOM is required for HUVEC phenotype and function.
a Western blot to show MECOM protein levels. b Representative images of in vitro tube formation in control and MECOM-KO HUVECs pool. c The number of EC tube branching points per high power field. d The length of EC branching tube. e Representative wound closure images at 0 h, 6 h, and 12 h after scratch. f Distance between the two borders (dotted lines in e) in wound closure images. g, h LDL uptake (g) and Nitric oxide production (h) in control and MECOM-KO HUVECs pool. i HUVEC Proliferation. Two CRISPR-Cas9 gRNAs g1 and g2 were tested. Error bars represent variation between replicates; n = 3 biologically independent samples. Data are presented as mean values ± SD; *P < 0.05, P values determined by two-tailed Student’s t test. Source data are provided as a Source Data file. |
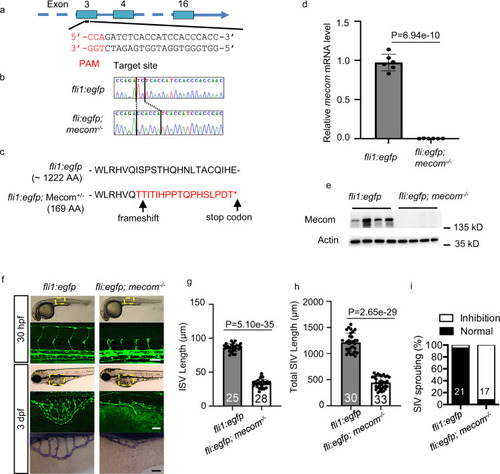
Depletion of mecom impairs zebrafish blood vessel formation.
a CRISPR-cas9 target site on mecom gene. The target sequence is based on the anti-sense strand. b DNA sequencing of mecom mutant animals. The PCR product covering the designed mutation site was cloned into T-vector and the individual colony harbored the insert was sent for DNA sequencing. The TC → CCACCA indel causing frameshift in mecom gene is highlighted. The vertical bars demarcate the mutation site. c mecom gene disruption produces a truncated protein. d Relative gene expression levels of mecom. e Western blot to show Mecom protein levels. f Confocal imaging of intersegmental vessel (ISV) at 30 hpf (top) and subintestinal vein (SIV) at 3 dpf (middle) as well as alkaline phosphatase staining of SIV at 3 dpf (bottom) of mecom mutant and wild type control. g, h Quantification of ISV length (g) and SIV length (h). i Percentage of larvae showing normal or inhibited SIV sprouting. Scale bars, 100 μm. Data are presented as mean values ± SD; n = 6 (d) and n = 4 (e) biologically independent samples, numbers of biologically independent animals analyzed are indicated in the bars of (f–i). P values are determined by two-tailed Student’s t test. Source data are provided as a Source Data file. |
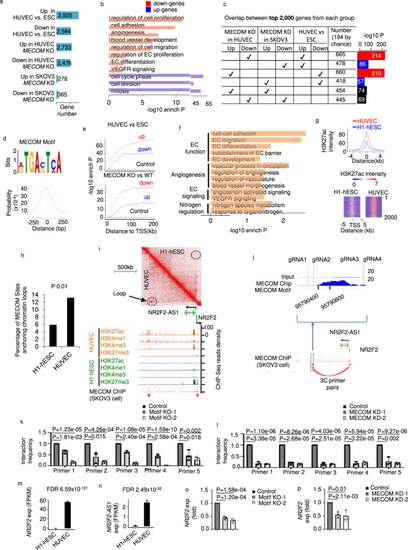
MECOM binds enhancers to regulate the transcriptional program for EC differentiation and function.
a Number of differentially regulated genes comparing pairs of conditions. b Pathways significantly enriched in differential genes between WT and MECOM KO HUVEC pool. c Pairwise comparisons among genes regulated by MECOM in HUVEC, genes regulated by MECOM in SKOV3 cell, and genes regulated in EC differentiation. d The MECOM binding motif (top) and its distribution around centers of ChIP-Seq enrichment peaks (bottom). e Enrichment of MECOM binding motif plotted against distance to genes differentially expressed in EC differentiation (top) or upon MECOM KO in EC (bottom). f Pathways enriched in genes associated with MECOM motif in promoter region from TSS to 5 kb upstream. g Average signal intensity of H3K27ac at MECOM target sites in HUVEC and H1-hESC (top) and heat map to show the signal intensity of H3K27ac at each base pair (column) of individual MECOM target site (row) (bottom). h Percentage of MECOM target sites overlap with chromatin loops in HUVEC and H1-hESC respectively. i Two-dimensional heat map of chromosomal contact frequency (top), signal density of chromatin marks and MECOM ChIP-Seq (bottom) at NR2F2/NR2F2-AS1 locus in HUVEC. Red arrows indicate enrichment peaks of ChIP-Seq signal for MECOM. j Location of inferred MECOM-to-NR2F2 binding site (in the blue box). The enlarged figure shows the location of MECOM binding signal, motif, and the four CRISPR gRNA locations. k, l Relative interaction frequency measured by 3 C assays. m, n Expression level of NR2F2 and NR2F2-AS1 in H1-hESC and HUVEC. o, p Relative gene expression levels of NR2F2. Data are presented as mean values ± SD; n = 3 (j–l and o, p) and n = 2 (m, n) biologically independent samples. P values are determined by a modified two-tailed Fisher Exact test implemented in DAVID v6.8 (b, f), two-tailed Fisher Exact test (c, e), two-tailed Poisson test (h), and two-tailed Negative Binomial test implemented in edgeR v3.14.0 (m, n), and two-tailed Student’s t test (k, l, o, p). Source data are provided as a Source Data file. |
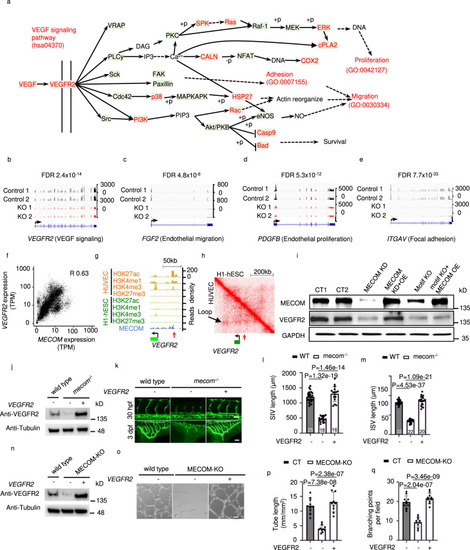
VEGF signaling pathway is a key target of MECOM.
a The schematic representation of VEGF signaling pathway defined in KEGG. Pathway members which significantly downregulated after MECOM KO in HUVEC were marked in red color. b–e Signal density of RNA-Seq at the locus of VEGFR2 (b), FGF2 (c), PDGFB (d), and ITGAV (e) in both Control and MECOM KO HUVEC pool. f Gene expression correlation between MECOM and VEGFR2. g ChIP-Seq read density for chromatin marks and the MECOM protein at VEGFR2 locus in HUVEC. Red arrow indicates the location of MECOM binding peak. h Two-dimensional heat map of chromosomal contact frequency at VEGFR2 locus in HUVEC and H1-hESC. Red arrow indicates the location of MECOM binding peak as in (g). i Western blot analysis of protein levels of MECOM, VEGFR2, and GAPDH in HUVECs. j Western blot analysis of protein levels of Vegfr2 and Tubulin in wild type and mecom knockout mutants (mecom−/−) zebrafish injected without (−) or with (+) modified mRNA (mmRNA) of VEGFR2. k ISV angiogenesis (top) and SIV angiogenesis (bottom) in wild type, mecom−/− zebrafish injected without (−) or with (+) VEGFR2 mmRNA. (l-m) Quantification of SIV length (l) and ISV length (m). n Western blot analysis of protein levels of Vegfr2 and Tubulin in control, MECOM KO HUVECs treated without (−) or with (+) VEGFR2 mmRNA. o Tube formation of control or MECOM KO HUVECs pool transfected without (−) or with (+) VEGFR2 mmRNA. p, q Quantification of tube length (p) and branching points per field (q). Scale bars, 100 μm. All values are indicated as mean ± SD (l, m, p, q); numbers of animals analyzed are indicated in the bars (k, l, m). n = 3 biologically independent samples (i, j, n, p, q). P values are determined by two-tailed Negative Binomial test implemented in edgeR v3.14 (b–e) and two-tailed Student’s t test (l, m, p, q), Source data are provided as a Source Data file. |