
Fig. 3
- ID
- ZDB-IMAGE-230518-77
- Publication
- Lv et al., 2023 - Epigenetic landscape reveals MECOM as an endothelial lineage regulator
- All Figures
- Figures for Lv et al., 2023
|
Fig. 3
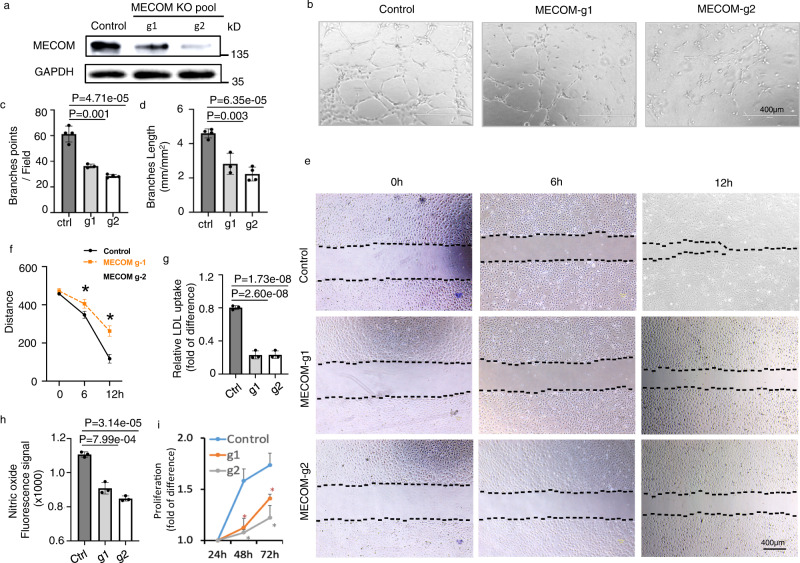
a Western blot to show MECOM protein levels. b Representative images of in vitro tube formation in control and MECOM-KO HUVECs pool. c The number of EC tube branching points per high power field. d The length of EC branching tube. e Representative wound closure images at 0 h, 6 h, and 12 h after scratch. f Distance between the two borders (dotted lines in e) in wound closure images. g, h LDL uptake (g) and Nitric oxide production (h) in control and MECOM-KO HUVECs pool. i HUVEC Proliferation. Two CRISPR-Cas9 gRNAs g1 and g2 were tested. Error bars represent variation between replicates; n = 3 biologically independent samples. Data are presented as mean values ± SD; *P < 0.05, P values determined by two-tailed Student’s t test. Source data are provided as a Source Data file.