
Fig. 6
- ID
- ZDB-IMAGE-230518-80
- Publication
- Lv et al., 2023 - Epigenetic landscape reveals MECOM as an endothelial lineage regulator
- All Figures
- Figures for Lv et al., 2023
|
Fig. 6
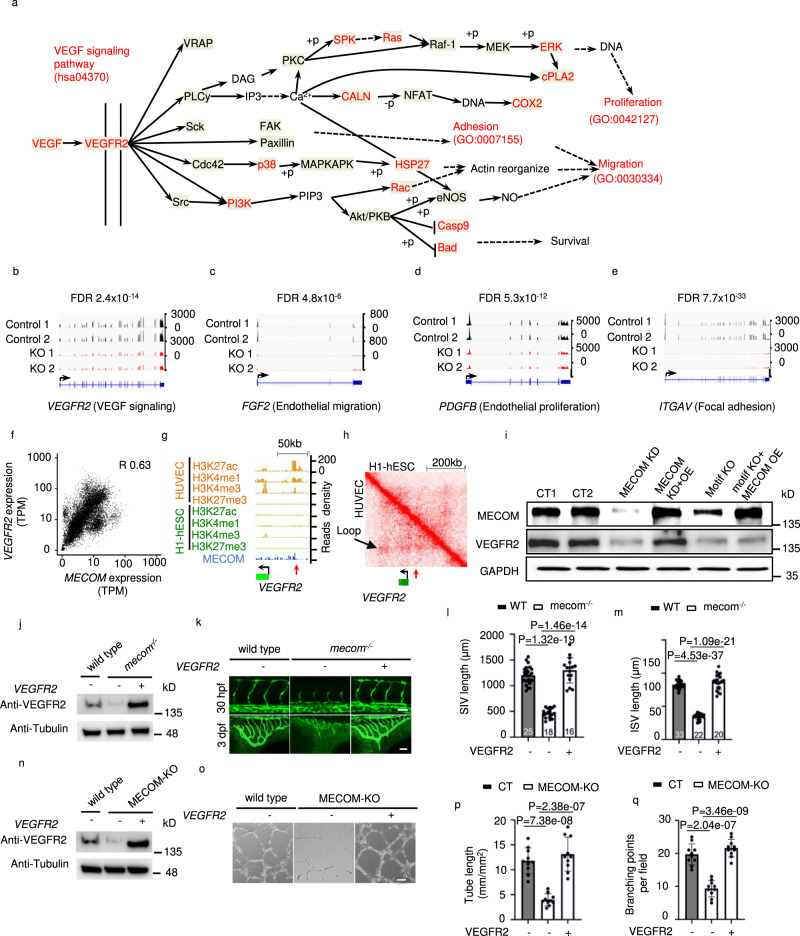
a The schematic representation of VEGF signaling pathway defined in KEGG. Pathway members which significantly downregulated after MECOM KO in HUVEC were marked in red color. b–e Signal density of RNA-Seq at the locus of VEGFR2 (b), FGF2 (c), PDGFB (d), and ITGAV (e) in both Control and MECOM KO HUVEC pool. f Gene expression correlation between MECOM and VEGFR2. g ChIP-Seq read density for chromatin marks and the MECOM protein at VEGFR2 locus in HUVEC. Red arrow indicates the location of MECOM binding peak. h Two-dimensional heat map of chromosomal contact frequency at VEGFR2 locus in HUVEC and H1-hESC. Red arrow indicates the location of MECOM binding peak as in (g). i Western blot analysis of protein levels of MECOM, VEGFR2, and GAPDH in HUVECs. j Western blot analysis of protein levels of Vegfr2 and Tubulin in wild type and mecom knockout mutants (mecom−/−) zebrafish injected without (−) or with (+) modified mRNA (mmRNA) of VEGFR2. k ISV angiogenesis (top) and SIV angiogenesis (bottom) in wild type, mecom−/− zebrafish injected without (−) or with (+) VEGFR2 mmRNA. (l-m) Quantification of SIV length (l) and ISV length (m). n Western blot analysis of protein levels of Vegfr2 and Tubulin in control, MECOM KO HUVECs treated without (−) or with (+) VEGFR2 mmRNA. o Tube formation of control or MECOM KO HUVECs pool transfected without (−) or with (+) VEGFR2 mmRNA. p, q Quantification of tube length (p) and branching points per field (q). Scale bars, 100 μm. All values are indicated as mean ± SD (l, m, p, q); numbers of animals analyzed are indicated in the bars (k, l, m). n = 3 biologically independent samples (i, j, n, p, q). P values are determined by two-tailed Negative Binomial test implemented in edgeR v3.14 (b–e) and two-tailed Student’s t test (l, m, p, q), Source data are provided as a Source Data file.