
- Title
-
Functional regionalization of the differentiating cerebellar Purkinje cell population occurs in an activity-dependent manner
- Authors
- Dorigo, A., Valishetti, K., Hetsch, F., Matsui, H., Meier, J.C., Namikawa, K., Köster, R.W.
- Source
- Full text @ Front. Mol. Neurosci.
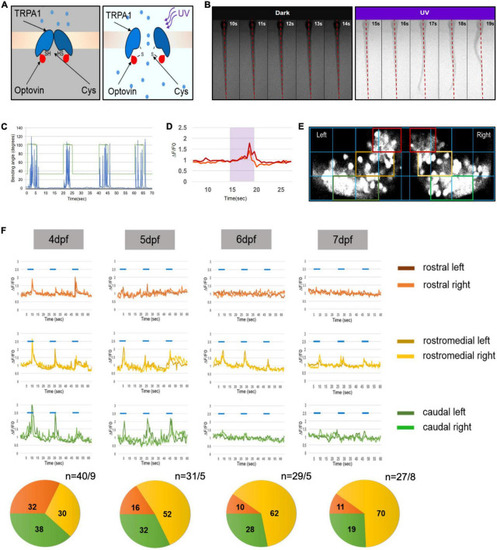
Progressive development of functional domains in the zebrafish Purkinje cell (PC) population during cerebellar development. (A) Graphic illustration of transient receptor potential A1 (TrpA1) channel activation in sensory neurons of the trunk by UV illumination of Optovin. (B) Montage of consecutive frames of 1 s intervals showing deflection of trunk in the presence of Optovin with and without UV light (red dashed line marks dorsal midline during resting state). (C) Graph illustrating angle of bending of trunk (blue peaks) during the time UV light was on (peaks in green) and off (green line). (D) Examples of Ca2+ transient amplitudes (red and orange) during Optovin induced swimming upon UV illumination (period marked in turquoise). (E) The grid used to define rostral (red boxes), rostromedial (yellow boxes) and caudal territories (green boxes) in the zebrafish PC layer expressing the calcium indicator GCaMP5G. (F) Illustration of measured swimming correlated Ca2+ transients (?F/F0) of different regions of PC layer from 4 to 7 dpf (blue lines indicate periods of UV-illumination). Pie charts below display the percentage of swimming-correlated Ca2+-transients within the different PC regions with respect to days of analysis. To the right of pie charts n indicates number of recorded transients/number of larvae. |
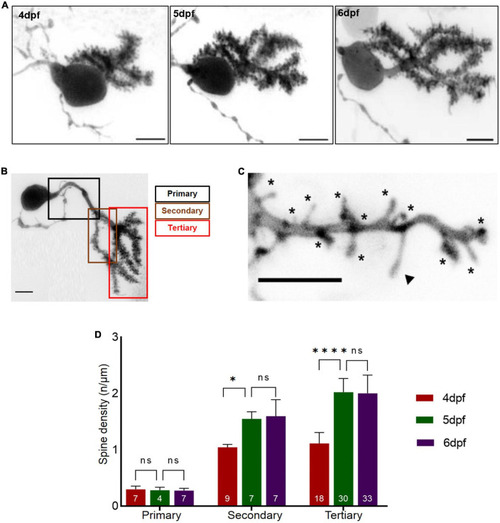
Dendritic spine density of individual Purkinje cell (PCs) with respect to developmental age of larvae. (A) Example of a 3D-reconstructed single PC from 4 to 6 dpf recorded by high-resolution confocal microscopy. Scale bar: 5 μm. (B) Single PC with demarcated dendritic branches. Scale bar: 5 μm. (C) Higher magnification of dendritic branch with visualized protrusions (asterisks indicate spines included for counting; arrowheads mark filopodia structures excluded from counting). Scale bar: 5 μm. (D). The graph displays spine density along primary, secondary and tertiary dendritic branches from 4 to 6 dpf larvae. The data are represented as mean + SD. Numbers inside the bars include total number of dendritic branches analyzed of different individual PCs. Ordinary one-way ANNOVA followed by Tukey’s multiple comparisons test was applied for normally distributed data, else Kruskal-Wallis test followed by Dunn’s multiple comparisons test was used in (D). Denotations for significance are non-significant (n s) p > 0.1234, *p < 0.0332, ****p < 0.0001. |
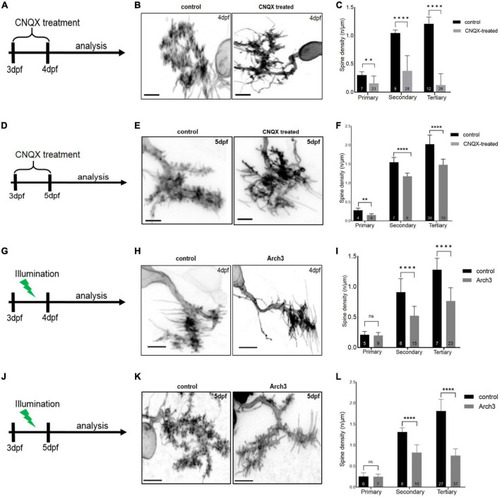
Inhibiting Purkinje cell (PC) neuronal activity reduces PC spine density. Schematic drawing illustrating the scheme of 6-cyano-7-nitroquinoxaline-2, 3-dione (CNQX) treatment from 3 dpf to analysis on 4 dpf (A) and on 5 dpf (D). Maximum intensity projection of untreated and CNQX treated PC at 4 dpf (B) and 5 dpf (E). Scale bar: 5 μm. Representation of spine density on primary, secondary and tertiary branches of CNQX treated PCs (gray) vs. controls (black) at 4 dpf (C) and at 5 dpf (F). Schematic drawing illustrating the start of pulsed illumination of 517 nm monochromatic light until the confocal microscopy analysis of Arch3 and non-Arch3 expressing larvae at 4 dpf (G) and 5 dpf (J). Maximum intensity projection of PC at 4 dpf (H) and 5 dpf (K) from Arch3 larvae and non-Arch3 expressing larvae, respectively. Scale bar: 5 μm. Graph showing PC spine density quantification in 4 dpf larvae (I) and 5 dpf larvae (L) on primary, secondary and tertiary dendritic branches of Arch3 larvae (gray) vs. controls (black). The data in graphs are presented as mean + SD. Numbers inside the bars include total number of dendritic branches analyzed of different individual PCs. For (C), (F), (I), (L) two-tailed unpaired t-test for normally distributed data with equal variances was used, for normally distributed data with unequal variances two-tailed unpaired t-test with Welch’s correction was applied. Additionally, for the data that did not pass the normality test, two tailed Mann-Whitney test was applied. Denotations for significance are non-significant (n s) p > 0.1234, **p < 0.0021, ****p < 0.0001. |
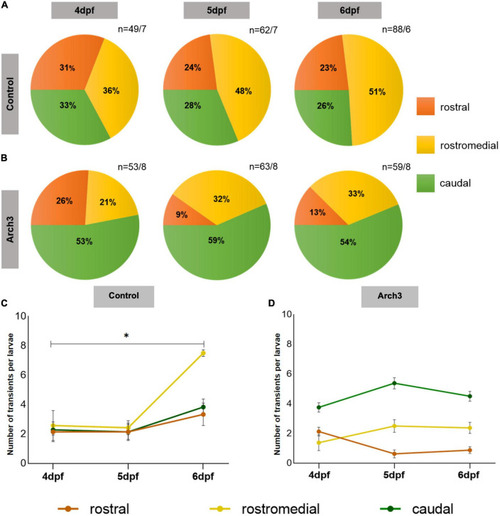
Formation of functional domains in the Purkinje cell (PC) population is impaired upon inhibiting PC neuronal activity. The pie charts represent the percentage of Optovin-induced swimming-correlated Ca2+ transients from 4 to 6 dpf localized in different regions of the PC layer. Ca2+ transients were recorded after continuous Arch3-stimulating illumination to suppress PC activity in (A) Tg(ca8-E1B:FMATagRFP,GCaMP5G)bz6 larvae as control and (B) Arch3-expressing Tg(ca8-E1B:Hso.Arch3-TagRFPT,GCaMP5G)bz5 larvae. n represents number of recorded Ca2+ transients/number of larvae. The number of transients per larvae in each PC subregion in (C) control and (D) Arch3-expressing larvae is displayed for consecutive days during which PC maturation occurs. The data are represented as mean ± SEM. Kruskal-Wallis test followed by Dunn’s multiple comparisons test was used in (C). Denotations for significance is *p < 0.0332. |