
|
FIGURE 3
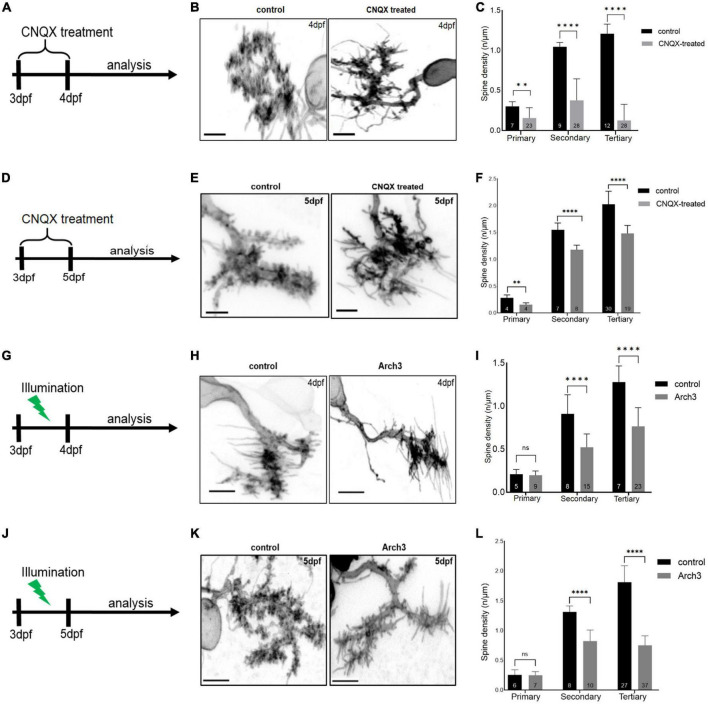
Inhibiting Purkinje cell (PC) neuronal activity reduces PC spine density. Schematic drawing illustrating the scheme of 6-cyano-7-nitroquinoxaline-2, 3-dione (CNQX) treatment from 3 dpf to analysis on 4 dpf (A) and on 5 dpf (D). Maximum intensity projection of untreated and CNQX treated PC at 4 dpf (B) and 5 dpf (E). Scale bar: 5 μm. Representation of spine density on primary, secondary and tertiary branches of CNQX treated PCs (gray) vs. controls (black) at 4 dpf (C) and at 5 dpf (F). Schematic drawing illustrating the start of pulsed illumination of 517 nm monochromatic light until the confocal microscopy analysis of Arch3 and non-Arch3 expressing larvae at 4 dpf (G) and 5 dpf (J). Maximum intensity projection of PC at 4 dpf (H) and 5 dpf (K) from Arch3 larvae and non-Arch3 expressing larvae, respectively. Scale bar: 5 μm. Graph showing PC spine density quantification in 4 dpf larvae (I) and 5 dpf larvae (L) on primary, secondary and tertiary dendritic branches of Arch3 larvae (gray) vs. controls (black). The data in graphs are presented as mean + SD. Numbers inside the bars include total number of dendritic branches analyzed of different individual PCs. For (C), (F), (I), (L) two-tailed unpaired t-test for normally distributed data with equal variances was used, for normally distributed data with unequal variances two-tailed unpaired t-test with Welch’s correction was applied. Additionally, for the data that did not pass the normality test, two tailed Mann-Whitney test was applied. Denotations for significance are non-significant (n s) p > 0.1234, **p < 0.0021, ****p < 0.0001.