
FIGURE 1
- ID
- ZDB-FIG-230515-47
- Publication
- Dorigo et al., 2023 - Functional regionalization of the differentiating cerebellar Purkinje cell population occurs in an activity-dependent manner
- Other Figures
- All Figure Page
- Back to All Figure Page
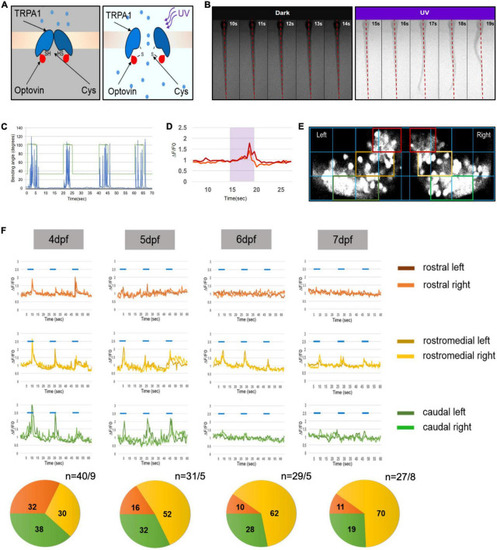
Progressive development of functional domains in the zebrafish Purkinje cell (PC) population during cerebellar development. (A) Graphic illustration of transient receptor potential A1 (TrpA1) channel activation in sensory neurons of the trunk by UV illumination of Optovin. (B) Montage of consecutive frames of 1 s intervals showing deflection of trunk in the presence of Optovin with and without UV light (red dashed line marks dorsal midline during resting state). (C) Graph illustrating angle of bending of trunk (blue peaks) during the time UV light was on (peaks in green) and off (green line). (D) Examples of Ca2+ transient amplitudes (red and orange) during Optovin induced swimming upon UV illumination (period marked in turquoise). (E) The grid used to define rostral (red boxes), rostromedial (yellow boxes) and caudal territories (green boxes) in the zebrafish PC layer expressing the calcium indicator GCaMP5G. (F) Illustration of measured swimming correlated Ca2+ transients (?F/F0) of different regions of PC layer from 4 to 7 dpf (blue lines indicate periods of UV-illumination). Pie charts below display the percentage of swimming-correlated Ca2+-transients within the different PC regions with respect to days of analysis. To the right of pie charts n indicates number of recorded transients/number of larvae. |