
FIGURE 2
- ID
- ZDB-FIG-230515-48
- Publication
- Dorigo et al., 2023 - Functional regionalization of the differentiating cerebellar Purkinje cell population occurs in an activity-dependent manner
- Other Figures
- All Figure Page
- Back to All Figure Page
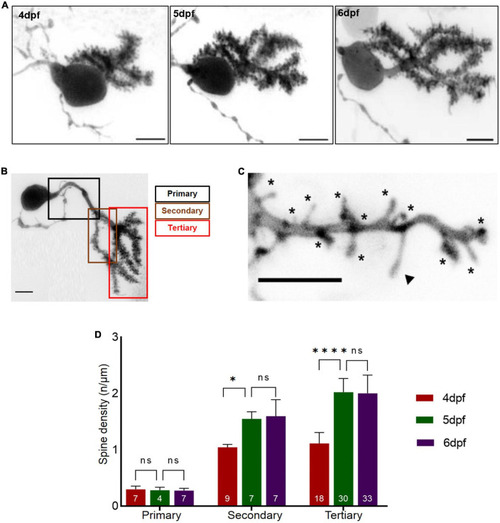
Dendritic spine density of individual Purkinje cell (PCs) with respect to developmental age of larvae. (A) Example of a 3D-reconstructed single PC from 4 to 6 dpf recorded by high-resolution confocal microscopy. Scale bar: 5 μm. (B) Single PC with demarcated dendritic branches. Scale bar: 5 μm. (C) Higher magnification of dendritic branch with visualized protrusions (asterisks indicate spines included for counting; arrowheads mark filopodia structures excluded from counting). Scale bar: 5 μm. (D). The graph displays spine density along primary, secondary and tertiary dendritic branches from 4 to 6 dpf larvae. The data are represented as mean + SD. Numbers inside the bars include total number of dendritic branches analyzed of different individual PCs. Ordinary one-way ANNOVA followed by Tukey’s multiple comparisons test was applied for normally distributed data, else Kruskal-Wallis test followed by Dunn’s multiple comparisons test was used in (D). Denotations for significance are non-significant (n s) p > 0.1234, *p < 0.0332, ****p < 0.0001. |