
- Title
-
Hdac1-deficiency affects the cell cycle axis Cdc25-Cdk1 causing impaired G2/M phase progression and reduced cardiomyocyte proliferation in zebrafish
- Authors
- Boos, A., Gahr, B.M., Park, D.D., Braun, V., Bühler, A., Rottbauer, W., Just, S.
- Source
- Full text @ Biochem. Biophys. Res. Commun.
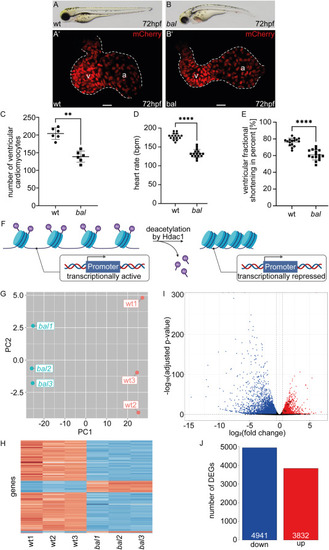
The baldrian mutation results in a reduced number of ventricular cardiomyocytes and a large number of DEGs (A–B) Lateral view of representative 72 h post fertilization (hpf) wildtype sibling (wt) (A) and baldrian (bal) mutant embryos (B). (A′-B′) Embryonic hearts of bal x Tg[myl7:mCherry-NLS] expressing mCherry in cardiomyocyte nuclei. Size of the ventricle appears reduced in bal mutants (B′) compared to wt (A′) (v: ventricle, a: atrium, scale bar 20 μm). (C) Ventricular cardiomyocyte numbers are significantly reduced in bal mutants (wt 204.17 ± 16.39, n = 6, bal 138.83 ± 15.96, n = 6, Mann-Whitney-test, ∗∗p < 0.01). (D) Heart rate in beats per minute (bpm) is reduced in bal (wt 178.13 ± 8.41, n = 16, bal 132.75 ± 10.71, n = 16, Mann-Whitney-test, ∗∗∗∗p < 0.0001). (E) The ventricular fractional shortening is significantly reduced in bal mutants (wt 76.26 ± 4.67%, n = 16, bal 60.98 ± 6.06%, n = 16, Mann-Whitney-test, ∗∗∗∗p < 0.0001) (F) Scheme of transcriptionally active chromatin deacetylation by Hdac1, resulting in compact chromatin with reduced access for the transcription machinery and therefore, transcriptional repression (modified image using BioRender.com [39])(G) Principal component analysis (PCA) plotting the Principal Component 2 (PC2) of the six analyzed RNA-sequencing samples against the PC1. Wt samples are labeled in red and bal samples in blue. Wt and bal cluster in PC1 (−25.31 (bal1), −25.94 (bal2), −25.50 (bal3), 27.08 (wt1), 25.15 (wt2), 24.53 (wt3)), whereas the individual replicates are separated by PC2 (2.64 (bal1), −0.64 (bal2), −1.79 (bal3), 4.81 (wt1), −4.06 (wt2), −0.97 (wt3)). (H) Heatmap of gene expression of the 500 most variable genes showing a clear difference between wt and bal samples. Low read counts are indicated in blue and high read counts in red. (I) Volcano plot of differentially expressed genes (DEGs) in bal compared to wt. Significantly upregulated (red) and downregulated genes (blue) are color-coded according to adjusted p-value<0.05 and |log2(FC)|>0.5. Main regulators of DNA damage response are highlighted in dark red. (J) Barplot of down- (4941) and upregulated (3832) DEGs with the threshold adjusted p-value<0.05 and |log2(FC)|>0.5. PHENOTYPE:
|

Hdac1-deficiency leads to an activation of DNA damage response (A) Dotplot displays the top 15 activated and suppressed Gene Ontology terms. Dots are color-coded according to the adjusted p-value and their size is in relation with the counts. The gene ratio describes the ratio of counts and total number of genes in the gene set. The GO-Term “DNA damage checkpoint” is highlighted in red. (B) Western Blot analysis of wildtype sibling (wt) and baldrian (bal) protein lysate showing the amount of γH2AX with pan Cadherin as control. (C) Quantification of Western Blot analysis (bal 14.56 ± 14.86, n = 8, Mann-Whitney-test, ∗∗∗p < 0.001). (D–E) Merged images of embryonic hearts of wt (D) and bal (E) from bal x Tg[myl7:DsRed-NLS] expressing DsRed in cardiomyocyte nuclei (red) stained with γH2AX antibody (green) (v: ventricle, a: atrium, scale bar 20 μm). (F) Quantification of γH2AX+ cardiomyocytes in relation to total cardiomyocyte numbers (wt 25.01 ± 8.749%, n = 7, bal 62.66 ± 12.93%, n = 8, Mann-Whitney-test, ∗∗∗p < 0.001). EXPRESSION / LABELING:
PHENOTYPE:
|
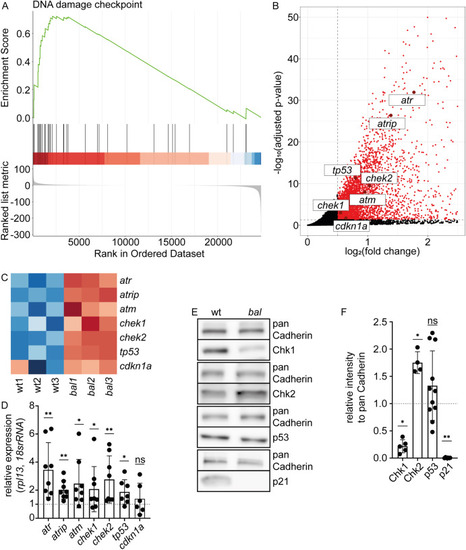
p21, a key regulator of DNA damage response, is lost in baldrian mutants (A) Gene set enrichment analysis plot of the Gene Ontology term “DNA damage checkpoint” visualizes that upregulated genes are overrepresented in this gene set in baldrian mutants (ES = 0.72, normalized ES = 1.70, adjusted p-value = 0.0069). (B) Zoom-in of the Volcano plot showing significantly upregulated genes in baldrian mutants in red (adjusted p-value<0.05, log2(FC) > 0.5) and genes of interest labeled with their gene name. (C) Heatmap of selected genes color-coding the expression in the different RNA-sequencing samples. Red indicates increased and blue decreased expression. (D) Quantification of quantitative real-time PCR (qRT-PCR) verifying the results obtained by RNA-seq (atr 3.45 ± 1.94, n = 8, atrip 2.02 ± 0.66, n = 8, atm 2.46 ± 1.72, n = 8, chek1 2.08 ± 1.61, n = 8, chek2 2.76 ± 1.68, n = 8, tp53 1.87 ± 0.87, n = 7, cdkn1a/p21 1.39 ± 1.10, n = 6, Wilcoxon test, ns: p > 0.05, ∗p < 0.05, ∗∗p < 0.01). (E) Western Blot analysis of candidate proteins involved in DNA damage response comparing wt and bal protein lysates in comparison to pan Cadherin as loading control. (F) Quantification of protein levels normalized to pan Cadherin and the wt (Chk1 (gene chek1) 0.22 ± 0.12, n = 5, Chk2 (gene chek2) 1.75 ± 0.20, n = 4, p53 (gene tp53) 1.33 ± 0.64, n = 11, p21 (gene cdkn1a) 0.006 ± 0.006, n = 6, Mann-Whitney-test, ns: p > 0.05, ∗p < 0.05, ∗∗p < 0.01). EXPRESSION / LABELING:
PHENOTYPE:
|
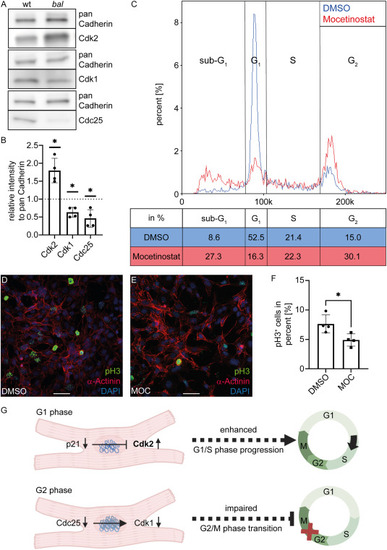
G2 cell cycle arrest is not mediated by p21 (A) Western Blot analysis shows an increase of Cdk2 protein level and reduced protein level of Cdk1 and Cdc25 in relation to the loading control. (B) Quantification of Western Blot confirmed that result (Cdk2 1.80 ± 0.34, n = 4, Cdk1 0.63 ± 0.14, n = 4, Cdc25 0.46 ± 0.24, n = 4, Mann-Whitney-test, ∗p < 0.05). (C) Cytometer-based cell cycle analysis of Mocetinostat (MOC) treated HL-1 cells showed reduced numbers of cells in G1 phase (16.3% MOC and 52.5% DMSO treatment) and an increased number of cells in G2 phase (30.1% MOC and 15.0% DMSO treatment) (D–E) Merged image of stained HL-1 cells treated with DMSO (D) or MOC (E). The mitotic marker pH3 is labeled in green, α-Actinin in red, and nuclei are stained with DAPI (blue, scale bar 50 μm). (F) Analysis of pH3+ HL-1 cells in immunofluorescence staining verified a significant reduction after MOC treatment compared to the control (DMSO 7.63 ± 1.53%, n = 4, MOC 4.90 ± 1.05%, n = 4, Mann-Whitney-test, ∗p < 0.05). (G) Schematic overview of cell cycle regulation in the Hdac1-deficient zebrafish mutant baldrian. p21 protein levels are reduced despite activated DNA damage response pathways resulting in increased protein level of Cdk2. Progression through G2/M phase is prevented by reduced Cdc25 and Cdk1 levels. Figure created using BioRender.com |