
|
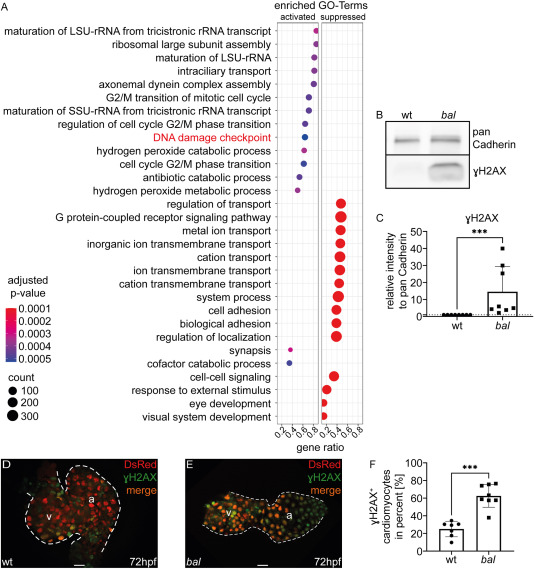
Fig. 2 Hdac1-deficiency leads to an activation of DNA damage response (A) Dotplot displays the top 15 activated and suppressed Gene Ontology terms. Dots are color-coded according to the adjusted p-value and their size is in relation with the counts. The gene ratio describes the ratio of counts and total number of genes in the gene set. The GO-Term “DNA damage checkpoint” is highlighted in red. (B) Western Blot analysis of wildtype sibling (wt) and baldrian (bal) protein lysate showing the amount of γH2AX with pan Cadherin as control. (C) Quantification of Western Blot analysis (bal 14.56 ± 14.86, n = 8, Mann-Whitney-test, ∗∗∗p < 0.001). (D–E) Merged images of embryonic hearts of wt (D) and bal (E) from bal x Tg[myl7:DsRed-NLS] expressing DsRed in cardiomyocyte nuclei (red) stained with γH2AX antibody (green) (v: ventricle, a: atrium, scale bar 20 μm). (F) Quantification of γH2AX+ cardiomyocytes in relation to total cardiomyocyte numbers (wt 25.01 ± 8.749%, n = 7, bal 62.66 ± 12.93%, n = 8, Mann-Whitney-test, ∗∗∗p < 0.001).