
|
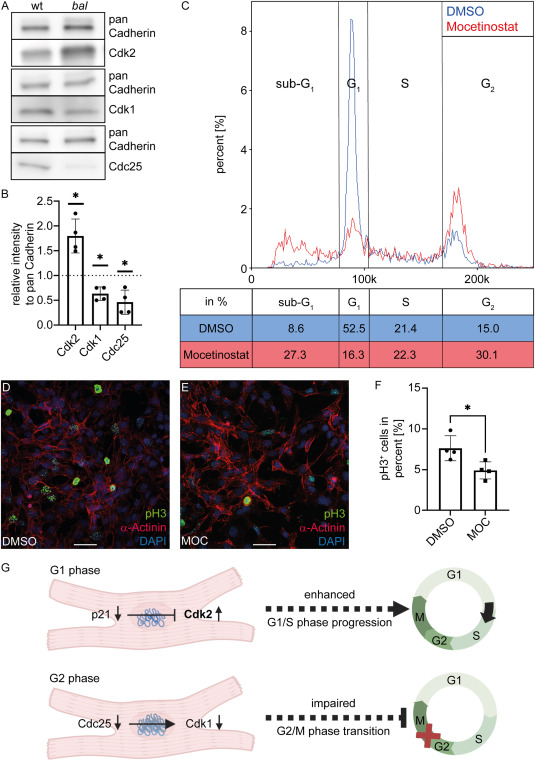
Fig. 4 G2 cell cycle arrest is not mediated by p21 (A) Western Blot analysis shows an increase of Cdk2 protein level and reduced protein level of Cdk1 and Cdc25 in relation to the loading control. (B) Quantification of Western Blot confirmed that result (Cdk2 1.80 ± 0.34, n = 4, Cdk1 0.63 ± 0.14, n = 4, Cdc25 0.46 ± 0.24, n = 4, Mann-Whitney-test, ∗p < 0.05). (C) Cytometer-based cell cycle analysis of Mocetinostat (MOC) treated HL-1 cells showed reduced numbers of cells in G1 phase (16.3% MOC and 52.5% DMSO treatment) and an increased number of cells in G2 phase (30.1% MOC and 15.0% DMSO treatment) (D–E) Merged image of stained HL-1 cells treated with DMSO (D) or MOC (E). The mitotic marker pH3 is labeled in green, α-Actinin in red, and nuclei are stained with DAPI (blue, scale bar 50 μm). (F) Analysis of pH3+ HL-1 cells in immunofluorescence staining verified a significant reduction after MOC treatment compared to the control (DMSO 7.63 ± 1.53%, n = 4, MOC 4.90 ± 1.05%, n = 4, Mann-Whitney-test, ∗p < 0.05). (G) Schematic overview of cell cycle regulation in the Hdac1-deficient zebrafish mutant baldrian. p21 protein levels are reduced despite activated DNA damage response pathways resulting in increased protein level of Cdk2. Progression through G2/M phase is prevented by reduced Cdc25 and Cdk1 levels. Figure created using BioRender.com