
- Title
-
SARM1 detection in myelinating glia: sarm1/Sarm1 is dispensable for PNS and CNS myelination in zebrafish and mice
- Authors
- Fazal, S.V., Mutschler, C., Chen, C.Z., Turmaine, M., Chen, C.Y., Hsueh, Y.P., Ibañez-Grau, A., Loreto, A., Casillas-Bajo, A., Cabedo, H., Franklin, R.J.M., Barker, R.A., Monk, K.R., Steventon, B.J., Coleman, M.P., Gomez-Sanchez, J.A., Arthur-Farraj, P.
- Source
- Full text @ Front. Cell. Neurosci.
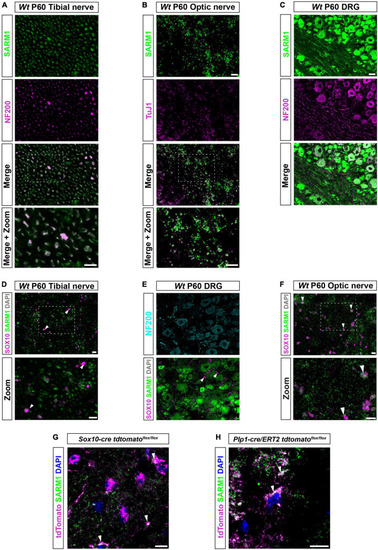
SARM1 protein is detectable in CNS myelinating glia but not PNS glia. (A) Representative immunofluorescence images of transverse sections of Wt mouse tibial nerves to show co-localization of SARM1 (green) and NF-200 (neurofilament light chain; magenta) in axons. Zoomed area is represented by the white bounding box. Scale bars 10 μm. (B) Representative immunofluorescence images of transverse sections of Wt mouse optic nerves to show expression of SARM1 (green) in TUJ1 (Anti-Beta III Tubulin; magenta) positive axons. Zoomed area is represented by the white bounding box. Scale bars 10 μm. (C) Representative immunofluorescence images of transverse sections of Wt mouse DRGs to show co-localization of SARM1 (green) and NF-200 (magenta) positive neurons. Scale bar 25 μm. (D) Representative immunofluorescence images of transverse sections of Wt and Sarm1 KO mouse tibial nerves showing SARM1 (green) and SOX10 (magenta) expression. White arrowheads show co-localization of DAPI (gray) and SOX10 (magenta), but no expression of SARM1 (green). Zoomed areas are represented by the white bounding box. Scale bar 10 μm. (E) Representative immunofluorescence images of transverse sections of Wt and Sarm1 KO mouse DRGs showing NF200 (cyan), SARM1 (green) and SOX10 (magenta) expression. White arrowheads point to SOX10 (magenta) positive satellite glia and DAPI (gray), with no colocalization of SARM1 (green). Scale bar 10 μm. (F) Representative immunofluorescence images of transverse sections of Wt and Sarm1 KO mouse optic nerves showing SARM1 (green) and SOX10 (magenta) expression. White arrowheads point to SOX10 (magenta) positive oligodendrocytes and DAPI (gray), with perinuclear SARM1 staining (green). Scale bar 10 μm. Zoomed areas are represented by the white bounding box. Scale bar 10 μm. All experiments n = 3 (3 animals, 2 nerves per animal, 5 sections per nerve). (G) Maximum projection of tdTomato positive oligodendrocytes in P60 optic nerves of Sox10-cre Rosa26 stopflox tdtomato (Sox10-cre tdtomatoflox/flox) positive for SARM1 immunolabelling (white arrowhead). Scale bar 10 μm. (H) Single confocal z plane of tdTomato positive oligodendrocytes in P60 optic nerves of Plp1-cre/ERT2 Rosa26 stopflox tdtomato (Plp1-cre/ERT2 tdtomatoflox/flox) positive for SARM1 immunolabelling (white arrowhead). Scale bar 10 μm. |
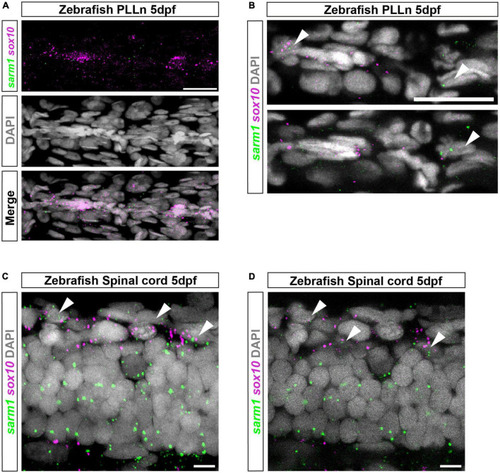
sarm1 expression in zebrafish larvae PLLn and spinal cord. (A) MAX projection, lateral view of PLLn of a 5dpf larva demonstrating HCR in situ labeling for sox10 and sarm1 mRNA and DAPI staining to mark nuclei. (B) Single confocal z plane, 616 nm optical thickness, lateral view of PLLn of a 5dpf larva. Arrowheads mark nuclei, labeled with DAPI, positive for sox10 and sarm1 mRNA. In the PLLn, 22.4% ± 3.161 [mean and standard error of mean (SEM), n = 5 larvae, 5 sections per larvae] of sox10 positive cells also expressed sarm1. (C) MAX projection, lateral view of spinal cord of a 5dpf larva demonstrating HCR in situ labeling for sox10 and sarm1 mRNA and DAPI staining to mark nuclei. Arrowheads mark nuclei positive for sox10 and sarm1 mRNA. (D) Single confocal z plane, 475 nm optical thickness, lateral view of spinal cord of a 5dpf larva. Arrowheads mark nuclei positive for sox10 and sarm1 mRNA. In the spinal cord, 60.3% ± 2.4 (mean and SEM, n = 5 larvae, 3 sections quantified per larvae) of sox10 positive cells also expressed sarm1. For all images: sox10 mRNA (magenta) and sarm1 mRNA (green), nuclei labeled with DAPI (gray), scale bar 25 μm. EXPRESSION / LABELING:
|
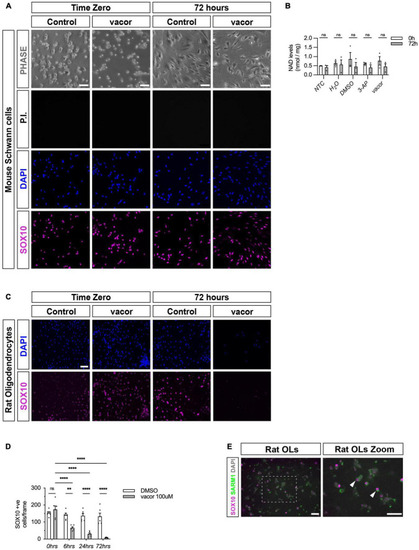
Cultured oligodendrocytes, but not Schwann cells, are sensitive to specific SARM1 activators. (A) Dissociated and freshly plated P2 mouse Schwann cells cultured in DMSO or 100 μM vacor for 72 h show no cell death, judged by propidium iodide (P.I.) and DAPI nuclear staining and SOX10 immunocytochemistry. 96.4% ± 0.3 SOX10 positive cells survived after 72 h 100 μM vacor treatment (mean and SEM, n = 3: two-four mice, each from three litters producing three separate cultures, p = 0.53). Scale bar 25 μm. (B) Intracellular NAD+ levels do not change in Schwann cells when treated for 72 h with either 250 μM 3-AP (mean and SEM of Time zero (TZ) 0.61 ± 0.05 and 72 h 0.4 ± 1.15, n = 3, p = 0.63) or 100 μM vacor (mean and SEM of TZ 0.76 ± 0.23 and 72 h 0.46 ± 0.16, n = 3, p = 0.63) compared to control conditions (mean and SEM of H20: TZ 0.64 ± 0.1, 72 h 0.56 ± 0.25, n = 3, p = 0.81; mean and SEM of DMSO: TZ 0.85 ± 0.36, 72 h 0.45 ± 0.22, n = 3, p = 0.61). (C) Rat oligodendrocytes cultured in DMSO or 100 μM vacor for 72 h demonstrate substantial cell death judged by DAPI nuclear staining and SOX10 immunocytochemistry (n = 5: one rat from five litters producing five separate cultures). Scale bar 50 μm. (D) Quantification of SOX10 positive oligodendrocyte cell survival in response to 100 μM vacor treatment compared to DMSO control cultures. After six, 24 and 72 h of 100 μM vacor treatment, 47.9% ± 6.5, 21.6% ± 4.5 and 6.5% ± 1.2 of SOX10 expressing cells survived respectively (mean and SEM, n = 5, p = 0.02, p < 0.0001, p < 0.0001 respectively). (E) Cultured rat oligodendrocytes (OLs; SOX10 positive) contain substantial SARM1 protein using a polyclonal anti-SARM1 antibody generated by Y-PH. Zoomed in area (indicated by dashed box). Arrowheads indicate SOX10 positive SARM1 positive cells. Scale bars 50 μm. **P < 0.01, ****P < 0.0001. |
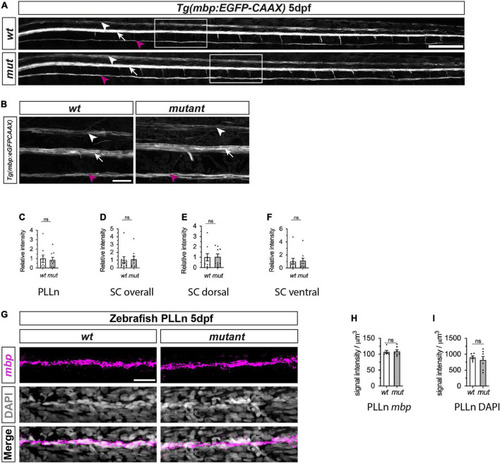
Myelination of PLLn and spinal cord is unaffected by absence of functional Sarm1 in zebrafish. (A) Max projection of the lateral view of wild-type (wt) Tg[mbp:EGFP-CAAX] and sarm1SA11193/SA11193 (sarm1 mutant, mut) Tg[mbp:EGFP-CAAX] 5dpf larva. Arrowhead (white) delineates the dorsal spinal cord; Arrow (white) marks the ventral spinal cord; Arrow (magenta) pinpoints the PLLn. Scale bar 100 μm. (B) Zoomed in lateral view of spinal cord and PLLn (area indicated by boxes in A). Arrowhead (white) delineates the dorsal spinal cord; Arrow (white) marks the ventral spinal cord; Arrow (magenta). Scale bar 25 μm. (C) Relative intensity of GFP in PLLn of Tg[mbp:EGFP-CAAX] wt, 1.0 ± 0.38and sarm1 mutant (mut), 0.86 ± 0.28 (mean and SEM, n = 9; p = 08633). (D) Relative intensity of GFP in the dorsal and ventral spinal cord combined of Tg[mbp:EGFP-CAAX] wt, 1.0 ± 0.44 and sarm1 mutant,1.08 ± 0.38 (mut) (mean and SEM, n = 9; p = 08633). (E) Relative intensity of GFP in the dorsal spinal cord of Tg[mbp: EGFP-CAAX] wt, 1.0 ± 0.35 and sarm1 mutant (mut), 1.03 ± 0.28 (mean and SEM, n = 9; p = 09314). (F) Relative intensity of GFP in the ventral spinal cord of Tg[mbp:EGFP-CAAX] wt, 1.0 ± 0.48 and sarm1 mutant (mut), 1.1 ± 0.44 (mean and SEM, n = 9; p = 08633). (G) MAX projection, lateral view of PLLn of wt and sarm1 mutant (mutant) 5dpf larvae showing mbp (magenta) mRNA expression. Nuclei labeled with DAPI (gray). Scale bar 25 μm. (H) Quantification of mbp mRNA signal intensity/um in PLLn of wt, 107.0 ± 4.72 and sarm1 mutant, 108.82 ± 5.14 (mut) 5dpf larvae (mean and SEM, WT n = 6; MUT n = 7; p = 0.8357). (I) Quantification of DAPI signal intensity/μm in PLLn of wt, 902.5 ± 45.2 and sarm1 mutant (mut), 822 ± 108.77, 5dpf larvae (mean and SEM, WT n = 6; MUT n = 7; p = 0.7308). |
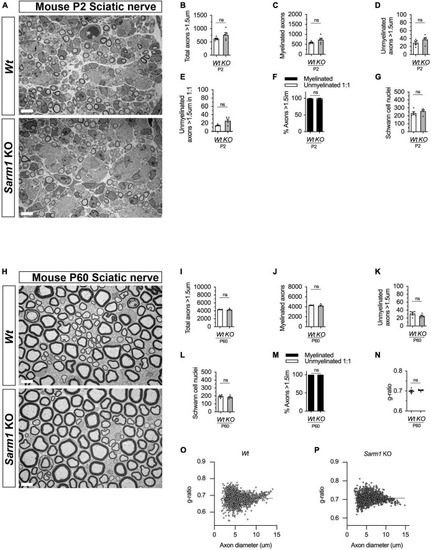
PNS myelination and myelin maintenance are normal in Sarm1 null mice. (A) Representative electron micrographs taken at x 3,000 magnification from Wt and Sarm1 knockout (KO) sciatic nerves at postnatal day 2 (P2). Scale bar 5 μm. (B) Per nerve profile, the total number of axons > 1.5 μm quantified are not significantly different in Wt, 621.0 ± 28.99, and Sarm1 KO, 763.0 ± 86.35, nerves (mean and SEM, n = 5; p = 0.3095). (C) The number of myelinated axons quantified per nerve profile are similar in both Wt, 591.2 ± 26.67, and Sarm1 KO, 725.0 ± 86.37, nerves (mean and SEM, n = 5; p = 0.3095). (D) The number of unmyelinated axons > 1.5 μm is not significantly different in Wt, 29.8 ± 3.77, and Sarm1 KO, 37.8 ± 4.73, nerves (mean and SEM, n = 5; p = 0.1508). (E) Per nerve profile, the number of unmyelinated axons > 1.5 μm in a ratio 1:1 is slightly higher in Sarm1 KO, 25.8 ± 3.96, nerves compared to Wt, 14.4 ± 0.98; however, this does not reach significance (mean and SEM, n = 5; p = 0.0873). (F) The percentage of myelinated axons versus non-myelinated axons present in Wt, 97.63% ± 0.19 and Sarm1 KO, 96.4% ± 0.75, nerves is not significantly different (n = 5; p = 0.1508). (G) The number of Schwann cell nuclei quantified per nerve profile is not significantly different between Wt, 234.0 ± 18.93 and Sarm1 KO, 258.2 ± 16.79 nerves (mean and SEM, n = 5; p = 0.5476). (H) Representative electron micrographs taken at x3000 magnification from adult Wt and Sarm1 KO sciatic nerves at P60. There are no ultrastructural differences in the sciatic nerves of adult Sarm1 KO compared to those of Wt sciatic nerves. Scale bar 5 μm. (I) Per nerve profile, the total number of axons > 1.5 μm quantified is similar in Wt, 4341 ± 34.27 and Sarm1 KO, 4241 ± 138.3 sciatic nerves (mean and SEM, n = 4; p = 0.3429). (J) The number of myelinated axons present in Wt, 4310 ± 31.37 and Sarm1 KO, 4216 ± 136.2 nerves is not significantly different (mean and SEM, n = 4; p = 0.3429). (K) Per nerve profile, the number of unmyelinated axons > 1.5 μm is not significantly different in Wt, 31.5 ± 3.86 and Sarm1 KO, 25.25 ± 2.4 nerves (mean and SEM, n = 4; p = 0.3429). (L) The number of Schwann cell nuclei is similar in both Wt, 196.0 ± 10.34 and Sarm1 KO, 183.3 ± 10.5 nerves (mean and SEM, n = 4; p = 0.4857). (M) The percentage of myelinated versus non-myelinated axons present in both Wt, 99.3 ± 0.09 and Sarm1 KO, 99.41 ± 0.04 nerves is not different (mean and SEM, n = 4; p = 0.3429). (N) Myelin sheath thickness as depicted by g-ratios is similar in both Wt, 0.69 ± 0.007 and Sarm1 KO, 0.704 ± 0.003 nerves (mean and SEM, n = 4; p = 0.4857). (O) Scatter plot of g-ratio as a function of axonal caliber in Wt sciatic nerves. (P) Scatter plot of g-ratio as a function of axonal caliber in Sarm1 KO sciatic nerves. |
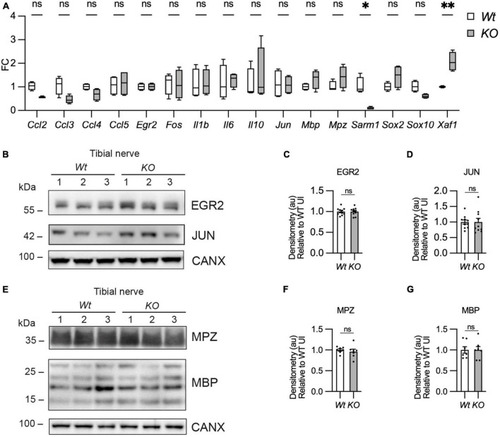
Myelin gene expression is normal in Sarm1 null peripheral nerves. (A) Relative mRNA expression for chemokine, Schwann cell injury and myelin genes in the P60 uninjured tibial nerve of Wt and Sarm1 KO mice. All fold change values normalized to uninjured Wt tibial nerve (n = 4; *p < 0.05, **p < 0.01). (B) Representative Western blot image of tibial nerve protein extracts from P60 Wt and Sarm1 KO mice. The image shows no difference in levels of EGR2 and JUN, between Wt and Sarm1 KO nerves. (C) There is no significant difference in EGR2 levels in Wt and Sarm1 KO nerves (n = 7; p = 0.9118). EGR2 protein levels are normalized to the levels in Wt nerves, which are set as 1. (D) There is no significant difference in JUN levels in Wt and Sarm1 KO nerves (n = 7; p = 0.5787). The quantifications are normalized to the levels in Wt nerves, which are set as 1. (E) Representative Western blot image showing no difference in levels of Myelin protein zero (MPZ) and Myelin basic protein (MBP), between P60 Wt and Sarm1 KO nerves. (F) There is no significant difference in MPZ levels in Wt and Sarm1 KO nerves (Wt n = 6; KO n = 5; p = 0.3176). The quantifications are normalized to the levels in Wt nerves, which are set as 1. (G) There is no significant difference in MBP levels in Wt and Sarm1 KO nerves (n = 7; p > 0.9999). The quantifications are normalized to the levels in Wt nerves, which are set as 1. |
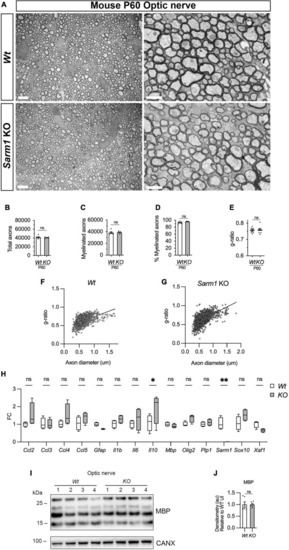
Optic nerve myelination is normal in Sarm1 null mice. (A) Representative electron micrographs taken at x 3,000 (left hand side panels) and x 12000 (right hand side panels) magnification from adult Wt and Sarm1 KO optic nerves at postnatal day 60 (P60). There are no ultrastructural differences in the optic nerves of Sarm1 KO compared to those of Wt animals. Scale bar 5 μm (x 3,000) and 2 μm (x 12,000). (B) The total number of axons quantified per optic nerve profile are not significantly different between Wt, 41422 ± 1375 and Sarm1 KO, 40484 ± 786 (mean and SEM, n = 6 Wt; n = 5 KO; p = 0.9307). (C) The number of myelinated axons quantified in Wt, 38457 ± 1441 and Sarm1 KO, 38782 ± 852.9 optic nerves is similar (mean and SEM, n = 6 Wt; n = 5 KO; p = 0.4286). (D) The percentage of myelinated axons quantified in Wt, 92.8 ± 1.2 and Sarm1 KO, 95.9 ± 0.5 optic nerves is not significantly different (mean and SEM, n = 6 Wt; n = 5 KO; p = 0.0736). (E) Myelin sheath thickness as depicted by g-ratios is similar in both Wt, 0.757 ± 0.007 and Sarm1 KO, 0.757 ± 0.01 optic nerves (mean and SEM, n = 6; p = 0.9610). (F) Scatter plot of g-ratio as a function of axonal caliber in Wt optic nerves. (G) Scatter plot of g-ratio as a function of axonal caliber in Sarm1 KO optic nerves. (H) Relative mRNA expression for chemokine, oligodendrocyte and myelin genes in the P60 uninjured optic nerve of Wt and Sarm1 KO mice. All fold change values normalized to uninjured Wt optic nerve (n = 4; *p < 0.05, **p < 0.01). (I) Representative western blot image of optic nerve protein extracts shows no difference in levels of MBP, between Wt and Sarm1 KO nerves. (J) There is no significant difference in MBP expression between Wt and Sarm1 KO optic nerves (n = 6; p = 0.3939). The quantifications are normalized to the levels in uninjured Wt nerves, which are set as 1. |