
FIGURE 5
- ID
- ZDB-FIG-230424-49
- Publication
- Fazal et al., 2023 - SARM1 detection in myelinating glia: sarm1/Sarm1 is dispensable for PNS and CNS myelination in zebrafish and mice
- Other Figures
- All Figure Page
- Back to All Figure Page
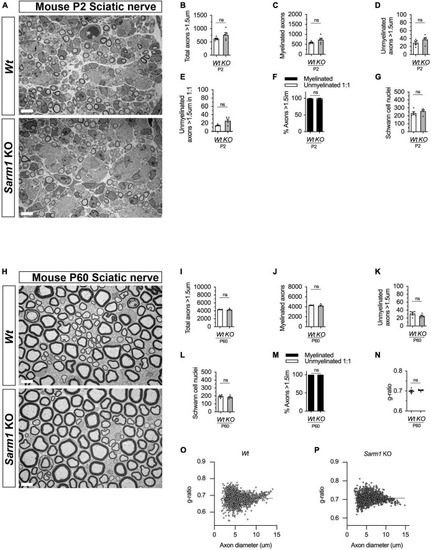
PNS myelination and myelin maintenance are normal in Sarm1 null mice. (A) Representative electron micrographs taken at x 3,000 magnification from Wt and Sarm1 knockout (KO) sciatic nerves at postnatal day 2 (P2). Scale bar 5 μm. (B) Per nerve profile, the total number of axons > 1.5 μm quantified are not significantly different in Wt, 621.0 ± 28.99, and Sarm1 KO, 763.0 ± 86.35, nerves (mean and SEM, n = 5; p = 0.3095). (C) The number of myelinated axons quantified per nerve profile are similar in both Wt, 591.2 ± 26.67, and Sarm1 KO, 725.0 ± 86.37, nerves (mean and SEM, n = 5; p = 0.3095). (D) The number of unmyelinated axons > 1.5 μm is not significantly different in Wt, 29.8 ± 3.77, and Sarm1 KO, 37.8 ± 4.73, nerves (mean and SEM, n = 5; p = 0.1508). (E) Per nerve profile, the number of unmyelinated axons > 1.5 μm in a ratio 1:1 is slightly higher in Sarm1 KO, 25.8 ± 3.96, nerves compared to Wt, 14.4 ± 0.98; however, this does not reach significance (mean and SEM, n = 5; p = 0.0873). (F) The percentage of myelinated axons versus non-myelinated axons present in Wt, 97.63% ± 0.19 and Sarm1 KO, 96.4% ± 0.75, nerves is not significantly different (n = 5; p = 0.1508). (G) The number of Schwann cell nuclei quantified per nerve profile is not significantly different between Wt, 234.0 ± 18.93 and Sarm1 KO, 258.2 ± 16.79 nerves (mean and SEM, n = 5; p = 0.5476). (H) Representative electron micrographs taken at x3000 magnification from adult Wt and Sarm1 KO sciatic nerves at P60. There are no ultrastructural differences in the sciatic nerves of adult Sarm1 KO compared to those of Wt sciatic nerves. Scale bar 5 μm. (I) Per nerve profile, the total number of axons > 1.5 μm quantified is similar in Wt, 4341 ± 34.27 and Sarm1 KO, 4241 ± 138.3 sciatic nerves (mean and SEM, n = 4; p = 0.3429). (J) The number of myelinated axons present in Wt, 4310 ± 31.37 and Sarm1 KO, 4216 ± 136.2 nerves is not significantly different (mean and SEM, n = 4; p = 0.3429). (K) Per nerve profile, the number of unmyelinated axons > 1.5 μm is not significantly different in Wt, 31.5 ± 3.86 and Sarm1 KO, 25.25 ± 2.4 nerves (mean and SEM, n = 4; p = 0.3429). (L) The number of Schwann cell nuclei is similar in both Wt, 196.0 ± 10.34 and Sarm1 KO, 183.3 ± 10.5 nerves (mean and SEM, n = 4; p = 0.4857). (M) The percentage of myelinated versus non-myelinated axons present in both Wt, 99.3 ± 0.09 and Sarm1 KO, 99.41 ± 0.04 nerves is not different (mean and SEM, n = 4; p = 0.3429). (N) Myelin sheath thickness as depicted by g-ratios is similar in both Wt, 0.69 ± 0.007 and Sarm1 KO, 0.704 ± 0.003 nerves (mean and SEM, n = 4; p = 0.4857). (O) Scatter plot of g-ratio as a function of axonal caliber in Wt sciatic nerves. (P) Scatter plot of g-ratio as a function of axonal caliber in Sarm1 KO sciatic nerves. |