
FIGURE 1
- ID
- ZDB-FIG-230424-44
- Publication
- Fazal et al., 2023 - SARM1 detection in myelinating glia: sarm1/Sarm1 is dispensable for PNS and CNS myelination in zebrafish and mice
- Other Figures
- All Figure Page
- Back to All Figure Page
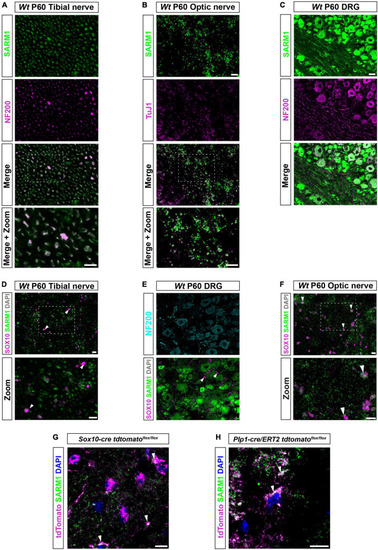
SARM1 protein is detectable in CNS myelinating glia but not PNS glia. (A) Representative immunofluorescence images of transverse sections of Wt mouse tibial nerves to show co-localization of SARM1 (green) and NF-200 (neurofilament light chain; magenta) in axons. Zoomed area is represented by the white bounding box. Scale bars 10 μm. (B) Representative immunofluorescence images of transverse sections of Wt mouse optic nerves to show expression of SARM1 (green) in TUJ1 (Anti-Beta III Tubulin; magenta) positive axons. Zoomed area is represented by the white bounding box. Scale bars 10 μm. (C) Representative immunofluorescence images of transverse sections of Wt mouse DRGs to show co-localization of SARM1 (green) and NF-200 (magenta) positive neurons. Scale bar 25 μm. (D) Representative immunofluorescence images of transverse sections of Wt and Sarm1 KO mouse tibial nerves showing SARM1 (green) and SOX10 (magenta) expression. White arrowheads show co-localization of DAPI (gray) and SOX10 (magenta), but no expression of SARM1 (green). Zoomed areas are represented by the white bounding box. Scale bar 10 μm. (E) Representative immunofluorescence images of transverse sections of Wt and Sarm1 KO mouse DRGs showing NF200 (cyan), SARM1 (green) and SOX10 (magenta) expression. White arrowheads point to SOX10 (magenta) positive satellite glia and DAPI (gray), with no colocalization of SARM1 (green). Scale bar 10 μm. (F) Representative immunofluorescence images of transverse sections of Wt and Sarm1 KO mouse optic nerves showing SARM1 (green) and SOX10 (magenta) expression. White arrowheads point to SOX10 (magenta) positive oligodendrocytes and DAPI (gray), with perinuclear SARM1 staining (green). Scale bar 10 μm. Zoomed areas are represented by the white bounding box. Scale bar 10 μm. All experiments n = 3 (3 animals, 2 nerves per animal, 5 sections per nerve). (G) Maximum projection of tdTomato positive oligodendrocytes in P60 optic nerves of Sox10-cre Rosa26 stopflox tdtomato (Sox10-cre tdtomatoflox/flox) positive for SARM1 immunolabelling (white arrowhead). Scale bar 10 μm. (H) Single confocal z plane of tdTomato positive oligodendrocytes in P60 optic nerves of Plp1-cre/ERT2 Rosa26 stopflox tdtomato (Plp1-cre/ERT2 tdtomatoflox/flox) positive for SARM1 immunolabelling (white arrowhead). Scale bar 10 μm. |