FIGURE SUMMARY
Title

Ultrafast light targeting for high-throughput precise control of neuronal networks

Authors
Faini, G., Tanese, D., Molinier, C., Telliez, C., Hamdani, M., Blot, F., Tourain, C., de Sars, V., Del Bene, F., Forget, B.C., Ronzitti, E., Emiliani, V.
Source
Full text @ Nat. Commun.

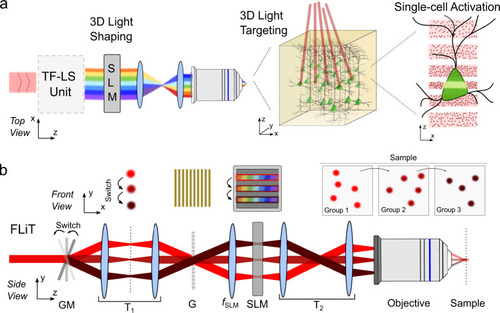
FLiT optical scheme.

a General optical scheme for temporally focused light shaping. A temporally focused light-shaping architecture (TF-LS) allows (i) sculpting light into specific patterns and (ii) temporally focusing the photons to confine photostimulation to a shallow axial region with cellular dimensions. A subsequent LC-SLM modulation allows multiplexing the sculpted light to multiple 3D sample locations (dots in the beam represent photons). b Optical setup of FLiT. A pulsed collimated beam (red line) is reflected by a galvanometric mirror (GM) onto a diffracting grating (G) via a 4f-telescope (T1). Diffracted off the grating, the beam is projected onto a liquid-crystal spatial light modulator (SLM) by a fSLM lens in the form of a horizontal (i.e., orthogonal to the orientation of the grating lines) spatially chirped strip of light. The LC-SLM is projected onto the back aperture objective (OBA) via a telescope (T2) so that ad hoc phase modulation on the LC-SLM allows multiplexing the initial beam and generating a multi-site temporally focused pattern of light in the sample. As deflection of the beam by the GM results into a translation of the illuminated bands on the LC-SLM (dark-red lines), addressing the LC-SLM with H independent tiled holograms φi can lead to fast switch of different groups of light patterns into the sample. The top and bottom drawing represents the XY and the YZ plane views, respectively.

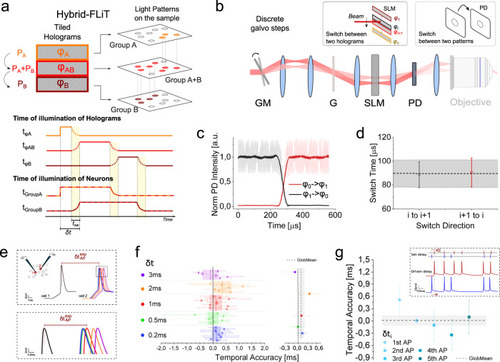
Tuning of neuronal activity in targeted neurons by hybrid-FLiT.

a Conceptual scheme of hybrid-FLiT. The LC-SLM is tiled in different regions each encoding different phase masks. In the present example, phase mask φA and φB encode for group of spots A and B, while phase mask φAB encodes for a comprehensive pattern including group A and group B. By steering the beam vertically across the phase masks with predetermined dwell-times and illumination intensities per each mask, it is possible to set arbitrary delays of activation between groups of spots. In the illustrated example, the illumination dwell time is tφA, tφAB, tφB, and the illumination power is PA, PA + PB, PB on the holograms φA, φAB, φB, respectively. On comprehensive phase mask φAB, the distribution of intensity must be computationally set to maintain an amount of power PA and PB on subgroup A and B, respectively. Overall, this scheme yields an activation time tφA + tφAB for group A, tφAB + tφB for group B and a delay of activation between group A and group B δt equivalent to tφA. tsw represents the switching time of the GM unit. Yellow vertical bands indicate the switching time tsw. The scheme displayed is meant to represent n groups of spots; their number is here limited to 2 for presentation purposes only. b Measurement of the switching time between two adjacent tiled holograms (φi and φi+1) when galvo moves in one discrete step. A photodiode (PD) is placed in an image conjugate plane while driving the galvanometric mirror (GM) with a small-angle single-step voltage input. c Representative intensity response of the PD when GM is switched from hologram φ1 (encoding for an individual spot in the middle of PD) to hologram φ0 (deviating the beam out of the PD) (black line) or, vice versa (red line). SLM was subdivided in 20 holograms. d Switch time calculated as the time taken for the signal to rise/fall between 3% and 97% of the maximum intensity, when the spot is encoded in hologram φi and GM is switched from hologram φi to φi+1 (black symbols) or vice versa (red symbols). Horizontal black line and shaded gray band indicate the global mean and SD switching time, respectively. e Schematics of the experiment for testing the timing of neuronal activity control. Two ST-ChroME expressing patched neurons (cell 1 and cell 2) are photostimulated by using hybrid-illumination of three holograms imposing a tightly controlled delays, 𝛿𝑡, ranging from 0.2 to 3 ms, while measuring the corresponding spiking delay time 𝛿texpAP. Different colors correspond to different delays. Bottom inset: detail of the AP peaks. f Left: Temporal accuracy calculated as the difference between imposed δt and experimental 𝛿texpAP delays, 𝛿texpAP𝛿t. Circle symbols represent different pair of cells activated with 𝛿𝑡 delays (data are shown as mean ± SD). Horizontal dashed line and bands of different colors represent the mean and SD at a specific delay δt as indicated on the left, respectively. Error bars are SD on n = 12 pairs of cells. Right: Global mean temporal accuracy of all pairs of cells shown on the left delayed of δt. Different colors correspond to different delays as indicated on the left. The vertical dashed line and the gray band indicate the average and SD temporal accuracy globally calculated for all pairs of cells (96 ± 114 µs). Data are shown as mean ± SD. Mean photostimulation power is 36.8 ± 20.9 mW. Illumination dwell time 4–5 ms. In total, 1030 nm illumination has been used. g Temporal accuracy of light-driven random spiking patterns calculated as difference between imposed 𝛿t𝑖 and experimental 𝛿texpAPi delays of the ith AP pair, 𝛿texpAPi𝛿t𝑖. Circles from light to dark blue indicate temporal accuracy from subsequent pairs of APs (data are shown as mean ± SD). The horizontal dashed line and the gray band indicate the average and SD temporal accuracy globally calculated for all pairs of cells (n = 6 pair of cells). Mean photostimulation power is 37.7 ± 21.3 mW. Illumination dwell time 2–5 ms. In all the panels, 1030 nm illumination has been used. Inset: Representative light-driven APs from two double-patched ST-ChroME-expressing neurons (bottom) by imposing a random spiking pattern featuring inter-spike-time intervals 𝛿𝑡𝑖 (top). Source data are provided as a Source Data file.

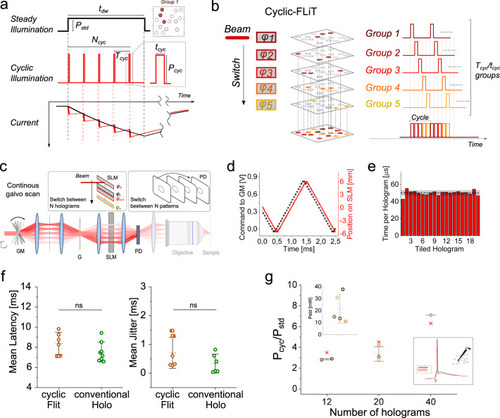
Photoactivation under cyclic-FLiT.

a Photostimulation of a group of neurons under steady and cyclic-illumination. A soma-targeted light pattern encoded by a single hologram can be used to photoactivate a group of neurons either under steady illumination of power 𝑃𝑠𝑡𝑑 and duration 𝑡𝑑𝑤 (black line, top) or under cyclic-illumination of 𝑁𝑐𝑦𝑐 pulses at power 𝑃𝑐𝑦𝑐, period 𝑇𝑐𝑦𝑐 and pulse duration 𝑡𝑐𝑦𝑐 (red line, middle). Simulated photocurrents generated in a ST-ChroME-expressing neuron are shown under steady (black, bottom) and cyclic (red, bottom) illumination when 𝑃𝑐𝑦𝑐=𝑃𝑠𝑡𝑑𝑇𝑐𝑦𝑐/𝑡𝑐𝑦𝑐 (𝑃𝑠𝑡𝑑=0.05 mW/µm2; 𝑃𝑐𝑦𝑐=0.0520 mW/µm2; 𝑇𝑐𝑦𝑐=20𝑡𝑐𝑦𝑐; 𝑡𝑐𝑦𝑐=50μs; 1030 nm). b Conceptual scheme of simultaneous photostimulation of multiple groups of neurons under cyclic-FLiT. The LC-SLM is tiled in multiple holograms φi (here from φ1 to φ5) each encoding for distinct soma-targeted multicell light patterns encoding for different groups of cells (here from Group 1 to Group 5). The illumination beam is switched across the holograms such that the light is sequentially redirected to 𝐻 = 1/D holograms, and the same cyclic photoactivation process is enabled sequentially on the different light patterns. The scheme displayed is meant to represent H groups of spots; their number is here limited to 5 for presentation purposes only. c Measurements of the switching time to sequentially illuminate all holograms at constant rate from φ1 to φn by driving the galvanometric mirror (GM) with a staircase voltage input. d GM voltage input (black line) and corresponding position of the incoming beam on the LC-SLM (red line) when GM is driven as depicted in (c). e Pulse-width dwell time of each hologram φi of the LC-SLM while GM is driven as depicted in (c) and φi only encodes an individual spot in the middle of the PD. Horizontal black and gray lines indicate the mean and SD dwell time over all holograms, respectively. f Mean latency and jitter of the light-evoked APs obtained under cyclic-FLiT (brown) and conventional illumination (green) for different number of holograms (n = 8 cells; data are shown as mean ±SD). For conventional holography: total illumination time 𝑡exp=𝑡𝑑𝑤= 5 ms; For cyclic-FLiT: total illumination time 𝑡exp= 5 ms; 𝑡𝑑𝑤=𝑡exp/𝐻). Data are nonsignificantly (ns) different between the two illumination protocols (P value = 0.23 and P value = 0.31 for latency and jitter, respectively; Mann–Whitney test, two-tailed). g Ratio of the powers needed to trigger a light-evoked AP with 5 ms total time of illumination under steady Pstd and cyclic-illumination Pcyc illumination and different number of holograms H. Different colors indicate different cells (n = 5 cells; data are shown as mean ±SD). Red asterisks represent the theoretical expected 𝐻 ratio value. Top inset: Threshold power to activate the cells under steady illumination with 𝑡𝑑𝑤=5ms. Bottom inset: representative light-evoked APs under steady (black) and cyclic (red) illumination of duration 5 ms. Source data are provided as a Source Data file.

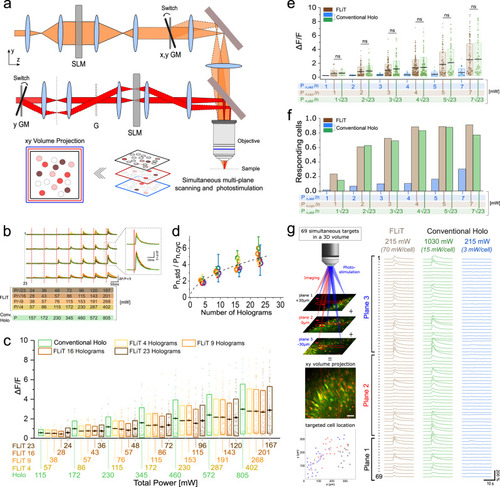
Multicell all-optical cyclic-FLiT.

a Scheme of the optical setup including: a multiplane imaging system (orange path) and a cyclic-FLiT photoactivation system (red path). Multiplane imaging relies on a SLM-based modulation of the incoming laser which splits the laser in multifoci beams simultaneously scanning axially-shifted planes (red, blue, and black planes). Multiple cells can be independently photoactivated in multiple-planes (red, light-red, and dark-red circles, limited to three planes for representation purposes). GM: Galvo-mirrors, G: diffraction grating. b Representative calcium traces from 4 neurons of a group of 23 co-expressing GCaMP7s and ST-ChroME cells simultaneously photoactivated by varying the illumination mode (cyclic-illumination with H = 4 (yellow line), H = 9 (orange line), H = 16 (light brown line), H = 23 (dark brown line) holograms or conventional steady holography (H = 1, green dashed line) and the illumination powers. Vertical red lines indicate the onset time of each photostimulation episode. The power corresponding to each photostimulation episode is indicated at the bottom with rows of different colors, each indicating the power used in the different illumination modes. Power was adapted such that the total power of cyclic-FLiT was reduced by a factor equal to 𝐻 compared to conventional holographic illumination. The inset represents a zoom of a part of the calcium traces. For conventional holography: total illumination time, for 𝑛 = 23 cells, 𝑡exp=𝑡𝑑𝑤= 10 ms; For cyclic-FLiT: total illumination time, for 𝑛 = 𝑚𝐻=23 cells, 𝑡exp=10ms;𝑡𝑑𝑤=𝑡exp/𝐻. c dF/F upon multicell all-optical photoactivation based on the illumination protocol depicted in (b). Different colors indicate different illumination modes as indicated in (b). Illumination powers corresponding to different illumination modes are indicated along the x bottom axis. Box bounds and box center indicate standard deviation and mean of the dF/F of all cells photoactivated in each illumination mode, respectively (4 FOV, 365 × 365 µm2, 23 cells simultaneously photoactivated per FOV). Circles indicate the dF/F of each cell. d Ratio of the total illumination power needed in conventional steady illumination and cyclic-FLiT (𝑃𝑛,𝑠𝑡𝑑𝑃𝑛,𝑐𝑦𝑐) to induce the same range of dF/F in the photoactivated cells for different numbers of holograms. Circles and bars indicate the mean and the standard deviation of the responding photoactivated cells binned on different ranges of dF/F (0.3<dF/F<0.5 blue, 0.5<dF/F<1 green, 1<dF/F<2 red, 2<dF/F<3 orange, 3<dF/F<5 purple, dF/F>5 yellow). Black dashed line indicates the theoretical 𝐻 factor. n = 23 cells per FOV; 4 FOVs. e, f dF/F (e) and fraction of responding cells (f) upon multicell all-optical photoactivation under cyclic-FLiT with H = 23 holograms (dark brown) and steady conventional illumination (blue) by keeping the same power per cell or by increasing the power of conventional illumination by 𝐻=23 (green). Box bounds and box center indicate standard deviation and mean of dF/F of all cells photoactivated in each illumination mode, respectively (Kruskal–Wallis test followed by Dunn’s multiple comparison; ns: P > 0.05; 4 2D-FOV, 350 × 350 µm2, 92 cells; 3 3D-FOV, 350 × 350 × 60 µm3, 115 cells). Circles indicate dF/F of each cell. g Left: Schematics of multifoci 2P scanning image of a set of 69 cells simultaneously photoactivated and recorded in a 3D volume. Cells are in three distinct planes 30 µm axially apart. Cells belonging to different planes are simultaneously monitored in a 2D XY volume projected image. Red and green corresponds to ST-ChroME and GCaMP7s labeling, respectively. The locations of the 69 photoactivated cells distributed across the three planes is indicated with different colors in the 2D map at the bottom (black, red and blue circles correspond to cells located in z = 30, 0, −30 µm plane, respectively). Scale bar: 50 µm. Right: Calcium transients associated to the 69 cells located in a 3D volume as depicted on the left, simultaneously photoactivated and recorded under cyclic-illumination with H = 23 holograms or conventional steady illumination (215 mW total power under cyclic-FLiT (brown line) and conventional illumination (blue lines) or 103021523 mW total power under conventional illumination (green lines)). The corresponding powers sent to each cells are also reported. For conventional holography: total illumination time, for 𝑛 = 69 cells, 𝑡exp=𝑡𝑑𝑤= 10 ms; For cyclic-FLiT: total illumination time, for 𝑛 = (𝑚𝐻)=69 cells (with H = 23 and m = 3 cells per hologram) 𝑡exp=10ms;𝑡𝑑𝑤=𝑡exp/𝐻). Source data are provided as a Source Data file.

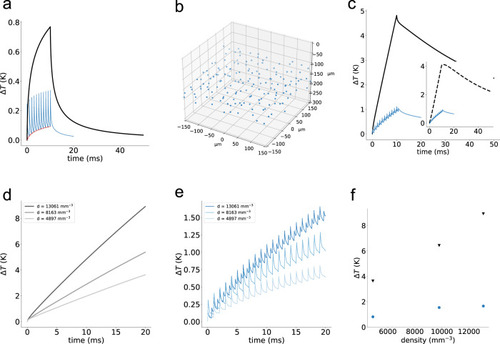
Simulated temperature rise under cyclic and conventional holographic illumination.

a Temperature rise induced on an illuminated spot under conventional (black) and cyclic-illumination (blue), using a power per cell, 𝑃𝑠𝑡𝑑, of 10 mW and 𝑃𝑐𝑦𝑐=𝐻𝑃𝑠𝑡𝑑= 𝐻10 mW, in conventional and cyclic-illumination, respectively; illumination t𝑑𝑤= 10 ms; H = 20; 50 µs illumination pulses; 1 ms per each cycle b Volumetric distribution of 160 spots (H = 20 holograms, m = 8 spot per hologram) uniformly distributed in a 350 × 350 × 100 µm3 volume. c Temperature rise induced on a central spot when 160 spots are illuminated as depicted in (b) under conventional (black) and cyclic-illumination (blue). Inset: Temperature rise induced on the central spot by the 159 neighboring spots. d, e Temperature rise for different spots density d distributed in the considered volume under conventional (d) and cyclic-illumination (e). f Maximum temperature rise for cyclic- and conventional-illumination as simulated in (d, e). t𝑑𝑤= 20 ms. Power per cell in conventional illumination 𝑃(𝑧)=10𝑒𝑧/𝓁𝑠 mW; Power per cell in cyclic-illumination 𝑃(𝑧)=10𝑒𝑧/𝓁𝑠𝐻; H = 20 in (bd).

Acknowledgments
This image is the copyrighted work of the attributed author or publisher, and ZFIN has permission only to display this image to its users. Additional permissions should be obtained from the applicable author or publisher of the image. Full text @ Nat. Commun.