
|
Fig. 2
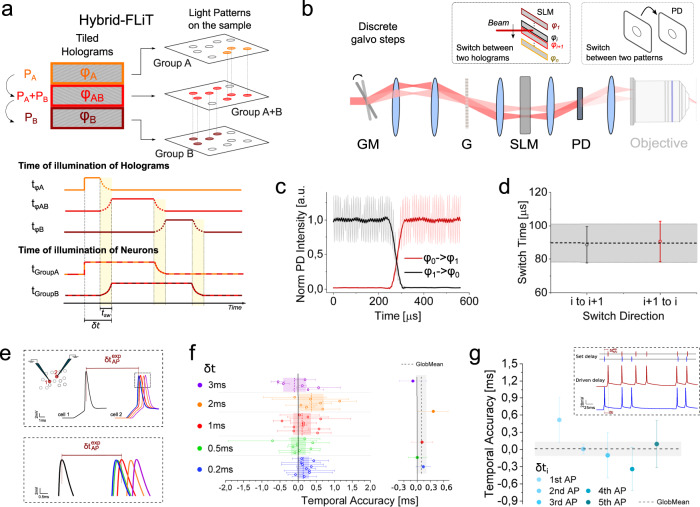
a Conceptual scheme of hybrid-FLiT. The LC-SLM is tiled in different regions each encoding different phase masks. In the present example, phase mask φA and φB encode for group of spots A and B, while phase mask φAB encodes for a comprehensive pattern including group A and group B. By steering the beam vertically across the phase masks with predetermined dwell-times and illumination intensities per each mask, it is possible to set arbitrary delays of activation between groups of spots. In the illustrated example, the illumination dwell time is tφA, tφAB, tφB, and the illumination power is PA, PA + PB, PB on the holograms φA, φAB, φB, respectively. On comprehensive phase mask φAB, the distribution of intensity must be computationally set to maintain an amount of power PA and PB on subgroup A and B, respectively. Overall, this scheme yields an activation time tφA + tφAB for group A, tφAB + tφB for group B and a delay of activation between group A and group B δt equivalent to tφA. tsw represents the switching time of the GM unit. Yellow vertical bands indicate the switching time tsw. The scheme displayed is meant to represent n groups of spots; their number is here limited to 2 for presentation purposes only. b Measurement of the switching time between two adjacent tiled holograms (φi and φi+1) when galvo moves in one discrete step. A photodiode (PD) is placed in an image conjugate plane while driving the galvanometric mirror (GM) with a small-angle single-step voltage input. c Representative intensity response of the PD when GM is switched from hologram φ1 (encoding for an individual spot in the middle of PD) to hologram φ0 (deviating the beam out of the PD) (black line) or, vice versa (red line). SLM was subdivided in 20 holograms. d Switch time calculated as the time taken for the signal to rise/fall between 3% and 97% of the maximum intensity, when the spot is encoded in hologram φi and GM is switched from hologram φi to φi+1 (black symbols) or vice versa (red symbols). Horizontal black line and shaded gray band indicate the global mean and SD switching time, respectively. e Schematics of the experiment for testing the timing of neuronal activity control. Two ST-ChroME expressing patched neurons (cell 1 and cell 2) are photostimulated by using hybrid-illumination of three holograms imposing a tightly controlled delays,