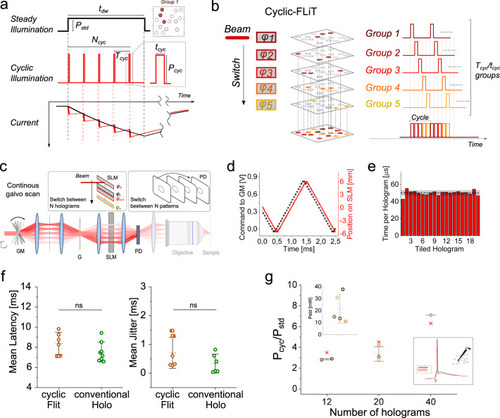
Photoactivation under cyclic-FLiT.a Photostimulation of a group of neurons under steady and cyclic-illumination. A soma-targeted light pattern encoded by a single hologram can be used to photoactivate a group of neurons either under steady illumination of power 𝑃𝑠𝑡𝑑 and duration 𝑡𝑑𝑤 (black line, top) or under cyclic-illumination of 𝑁𝑐𝑦𝑐 pulses at power 𝑃𝑐𝑦𝑐, period 𝑇𝑐𝑦𝑐 and pulse duration 𝑡𝑐𝑦𝑐 (red line, middle). Simulated photocurrents generated in a ST-ChroME-expressing neuron are shown under steady (black, bottom) and cyclic (red, bottom) illumination when 𝑃𝑐𝑦𝑐=𝑃𝑠𝑡𝑑𝑇𝑐𝑦𝑐/𝑡𝑐𝑦𝑐‾‾‾‾‾‾‾√ (𝑃𝑠𝑡𝑑=0.05 mW/µm2; 𝑃𝑐𝑦𝑐=0.0520‾‾‾√ mW/µm2; 𝑇𝑐𝑦𝑐=20𝑡𝑐𝑦𝑐; 𝑡𝑐𝑦𝑐=50μs; 1030 nm). b Conceptual scheme of simultaneous photostimulation of multiple groups of neurons under cyclic-FLiT. The LC-SLM is tiled in multiple holograms φi (here from φ1 to φ5) each encoding for distinct soma-targeted multicell light patterns encoding for different groups of cells (here from Group 1 to Group 5). The illumination beam is switched across the holograms such that the light is sequentially redirected to 𝐻 = 1/D holograms, and the same cyclic photoactivation process is enabled sequentially on the different light patterns. The scheme displayed is meant to represent H groups of spots; their number is here limited to 5 for presentation purposes only. c Measurements of the switching time to sequentially illuminate all holograms at constant rate from φ1 to φn by driving the galvanometric mirror (GM) with a staircase voltage input. d GM voltage input (black line) and corresponding position of the incoming beam on the LC-SLM (red line) when GM is driven as depicted in (c). e Pulse-width dwell time of each hologram φi of the LC-SLM while GM is driven as depicted in (c) and φi only encodes an individual spot in the middle of the PD. Horizontal black and gray lines indicate the mean and SD dwell time over all holograms, respectively. f Mean latency and jitter of the light-evoked APs obtained under cyclic-FLiT (brown) and conventional illumination (green) for different number of holograms (n = 8 cells; data are shown as mean ±SD). For conventional holography: total illumination time 𝑡exp=𝑡𝑑𝑤= 5 ms; For cyclic-FLiT: total illumination time 𝑡exp= 5 ms; 𝑡𝑑𝑤=𝑡exp/𝐻). Data are nonsignificantly (ns) different between the two illumination protocols (P value = 0.23 and P value = 0.31 for latency and jitter, respectively; Mann–Whitney test, two-tailed). g Ratio of the powers needed to trigger a light-evoked AP with 5 ms total time of illumination under steady Pstd and cyclic-illumination Pcyc illumination and different number of holograms H. Different colors indicate different cells (n = 5 cells; data are shown as mean ±SD). Red asterisks represent the theoretical expected 𝐻‾‾√ ratio value. Top inset: Threshold power to activate the cells under steady illumination with 𝑡𝑑𝑤=5ms. Bottom inset: representative light-evoked APs under steady (black) and cyclic (red) illumination of duration 5 ms. Source data are provided as a Source Data file.