FIGURE

Fig. 5

ID
ZDB-FIG-230901-14
Publication
Faini et al., 2023 - Ultrafast light targeting for high-throughput precise control of neuronal networks
Other Figures
All Figure Page
Back to All Figure Page
Fig. 5

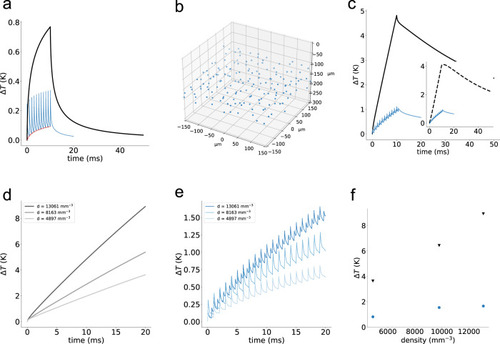
Simulated temperature rise under cyclic and conventional holographic illumination.

a Temperature rise induced on an illuminated spot under conventional (black) and cyclic-illumination (blue), using a power per cell, ๐‘ƒ๐‘ ๐‘ก๐‘‘, of 10 mW and ๐‘ƒ๐‘๐‘ฆ๐‘=๐ปโ‹…โ€พโ€พโ€พโˆš๐‘ƒ๐‘ ๐‘ก๐‘‘= ๐ปโ€พโ€พโˆšโ‹…10 mW, in conventional and cyclic-illumination, respectively; illumination t๐‘‘๐‘ค= 10 ms; H = 20; 50 ยตs illumination pulses; 1 ms per each cycle b Volumetric distribution of 160 spots (H = 20 holograms, m = 8 spot per hologram) uniformly distributed in a 350 ร— 350 ร— 100 ยตm3 volume. c Temperature rise induced on a central spot when 160 spots are illuminated as depicted in (b) under conventional (black) and cyclic-illumination (blue). Inset: Temperature rise induced on the central spot by the 159 neighboring spots. d, e Temperature rise for different spots density d distributed in the considered volume under conventional (d) and cyclic-illumination (e). f Maximum temperature rise for cyclic- and conventional-illumination as simulated in (d, e). t๐‘‘๐‘ค= 20 ms. Power per cell in conventional illumination ๐‘ƒ(๐‘ง)=10โ‹…๐‘’๐‘ง/๐“๐‘  mW; Power per cell in cyclic-illumination ๐‘ƒ(๐‘ง)=10โ‹…๐‘’๐‘ง/๐“๐‘ โ‹…๐ปโ€พโ€พโˆš; H = 20 in (bโ€“d).

Expression Data

Expression Detail
Antibody Labeling
Phenotype Data

Phenotype Detail
Acknowledgments
This image is the copyrighted work of the attributed author or publisher, and ZFIN has permission only to display this image to its users. Additional permissions should be obtained from the applicable author or publisher of the image. Full text @ Nat. Commun.