
- Title
-
Electric field-guided collective motility initiation of large epidermal cell groups
- Authors
- Sun, Y., Reid, B., Zhang, Y., Zhu, K., Ferreira, F., Estrada, A., Sun, Y., Draper, B., Yue, H., Copos, C., Lin, F., Bernadskaya, Y., Zhao, M., Mogilner, A.
- Source
- Full text @ Mol. Biol. Cell
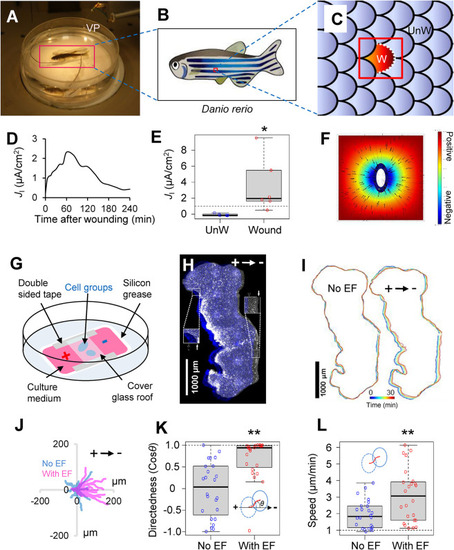
Physiological EF drives epidermal cell groups to the cathode. (A) Experimental setup to define bioelectrical field strength of scale wound–generated EFs. A vibrating probe (VP) is used to measure ionic currents around zebrafish scale wounds. (B) An individual wound was made by pulling a single scale (W). (C) Cartoon to show enlarged area in B. An adjacent scale is chosen as an unwound control (UnW). (D) Time lapse of a typical measurement of outward current up to 4 h after wounding. (E) Significant peak of outward electric current in scale wounds (n = 6) in comparison with unwounded scales (n = 6). *p < 0.05 by Student’s t test. (F) Computational simulation of electric potential based on ionic current measurements in a zebrafish scale wound as depicted in C. The EF direction is oriented to the center of the wound (arrows). Color-coded scale in arbitrary units. (G) Schematic view of the electrotaxis chamber and the setup for EF application. (H) Stitched phase contrast image of a large keratocyte group at the onset (blue) and after 30 min (gray) of the EF application in the indicated orientation. Inserts represent 2× magnification of checked cathodal/anodal edge areas. Arrows mark group’s boundaries before (open arrow) and after (solid arrow) EF application. This group contains approximately 13,600 cells. Scale bar, 1000 µm. (I) Group’s contour overlay before and after EF application, each for 30 min in a 5 min interval. Contours are color coded as shown in the color bar. Scale bar, 1000 µm. (J) Trajectories of keratocyte groups’ centroids (n = 17 for each condition). Duration: 30 min with (red) or without (blue) EF. Arrow indicates EF orientation. (K) Quantification of group directionality with (n = 24) or without (n = 24) EF (2 V/cm) application. Group migration (dash-lined and blue-lined eclipses) was tracked by monitoring centroid movement of each keratocyte group (red line). Directionality was calculated as cosθ. θ is the angle between the applied EF vector and vector (dashed line) connecting the first and last centroids of a group. **p < 0.01 by Student’s t test. (L) Quantification of group migration speed with (n = 24) or without (n = 24) EF (2 V/cm) application. Migration speed is calculated as the arc length of the trajectory (red curve) divided by the time. **p < 0.01 by Student’s t test. |
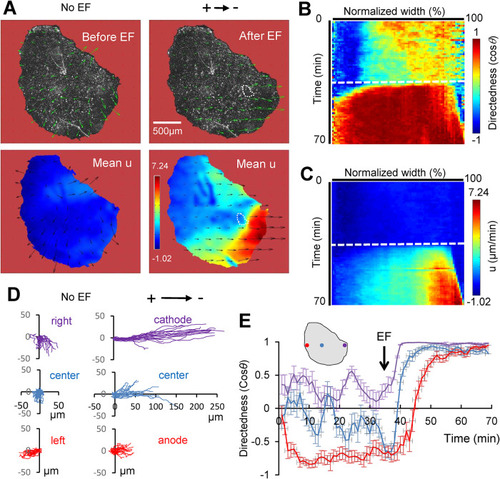
EF induces a distinct front-to-rear polarization pattern, resulting in regional migratory behavior. (A) PIV analysis of a representative keratocyte group (of approximately 7600 keratocytes) before (left panel) and after (right panel) EF application. Top row shows velocity vectors overlaid on phase contrast image; in the bottom row, color-coded, time-averaged components of velocity parallel to EF are shown (in µm/min, for EF of 2 V/cm). Scale bar, 500 µm. Note the increased alignment and magnitude of the velocity vectors, as well as regional front-to-rear differences induced by EF. White dashed enclosure highlights a hole in the group that was induced by EF. (B) Color-coded kymograph of directionality (cosθ). Vertical dimension is time in minutes, and horizontal dimension is projected mean directionality (cosθ) spanning the whole width of the keratocyte group; the EF oriented to the right. Dashed line indicates when EF (2 V/cm) is on. (C) Color-coded kymograph of the u-component (parallel to the EF) velocity in µm/min. Vertical dimension is time in minutes, and horizontal dimension is the projected time-averaged u-velocity spanning the whole width of the group. (D) Manually tracked cell trajectories in three regions (left, center, right) (n = 20 for each color-coded region) of the group before and after EF (2 V/cm in the indicated direction) application. Distances are in µm, and duration is 35 min. (E) Dynamics of mean directedness (cosθ) of the tracked regional cells. Directedness is calculated at 5 min intervals from a representative group in at least three repeated experiments. Error bars are SE for n = 20 regional cells. Color codes are the same as in D (positions are approximate). Arrow indicates when EF was switched on. |
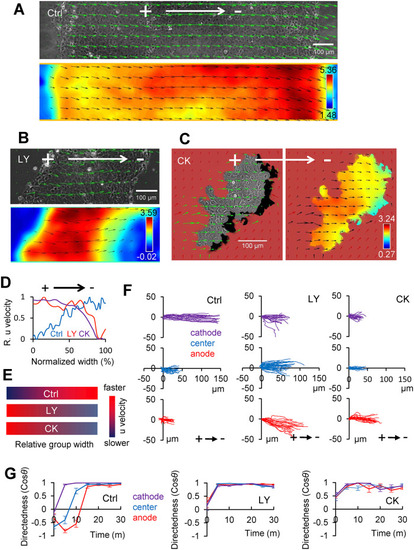
Inhibition of PI3K and Arp2/3 complex does not change cathodal motility of the whole group but reverses the velocity gradient within the group. (A) PIV maps of keratocyte groups in the absence (Ctrl) or (B) presence of 50 µM LY294002 compound (LY) or (C) CK666 (CK). Velocity vectors are overlaid on the phase contrast image of a slice of the group at the initial point or color-coded u-velocity map after 30 min of EF exposure (2 V/cm in the indicated direction). Scale bar, 100 μm. (D) Line scan of u-velocity (normalized from minimum [0] to maximum [1]) spanning groups in parallel to EF (the distance across the group’s width is normalized from 0 at the anode to 1 at the cathodal side). Note the reversed front-to-rear velocity gradient in the presence of LY or CK compared with that of the Ctrl. (E) Schematic summary of the velocity gradients in these three cases. (F) Manually tracked cell trajectories from the anodal, cathodal, and central regions. Each line represents an individual keratocyte (n = 20 from each color-coded zone) over a 30 min time course of EF application (2 V/cm in the indicated direction). Distances are in µm. (G) Dynamics of mean directedness (cosθ) of cells in three regions of Ctrl, LY, and CK groups under EF application (2 V/cm). Directedness is calculated from a representative group in at least three repeated experiments. Error bars are SE across for n = 20 regional cells. |
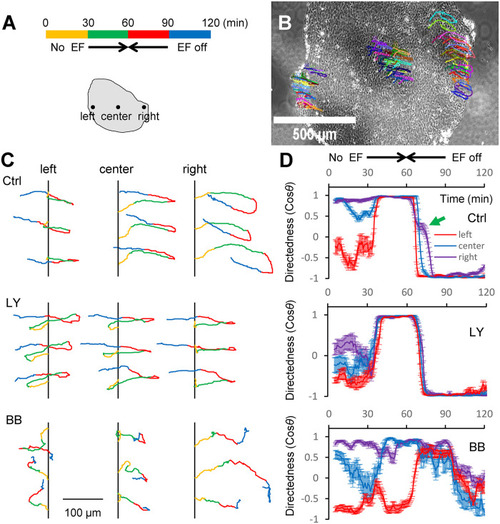
Myosin is necessary for collective EF sensing and EF-induced U-turns. (A) Color-coded time sequence of No EF, EF (2 V/cm) to the right, EF (2 V/cm) to the left, and EF off in 30 min intervals. Schematic below the time sequence shows three regions at the left, center, and right of the group from which cells are tracked. (B) U-turn tracks overlaid on the phase contrast image of the cell group. Each curve represents an individual cell trajectory. Arbitrary different colors are used to distinguish trajectories more easily. See also Supplemental Movies S8–S11. (C) Three randomly chosen cell trajectories are shown from each of the three regions of the group marked in A for each of the three chemical conditions—in the absence (Ctrl) or presence of 50 µM PI3K inhibitor LY294002 (LY) or myosin phosphorylation inhibitor BB. For visual clarity, in each set of three trajectories, the initial x-coordinate is shifted to the same vertical line while the initial y-coordinate is shifted to sufficiently separate the trajectories. The color coding along the trajectories is the same as in A to better visualize the directions in which the cells are moving during each of the four EF time intervals. Scale bar, 100 μm. (D) Dynamics of mean directedness (cosθ) of regional cells (color codes and timescale apply to all three plots). Directedness is calculated in 5 min intervals of representative groups in at least two repeated experiments in each condition. Error bars are SEs for n regional cells (n between 15 and 20) for each region. The green arrow points to delayed directional response of former “leader”/new “trailer” cells in Ctrl. |
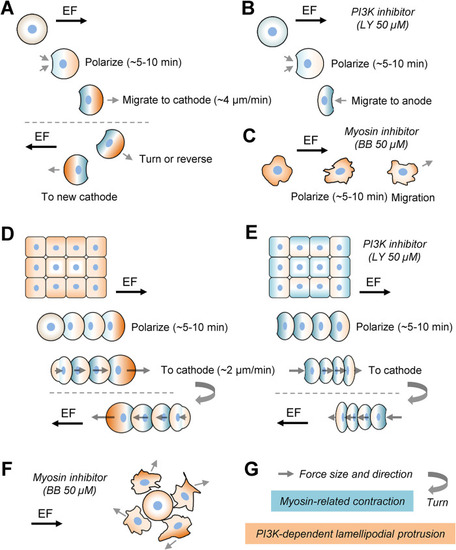
Qualitative model of collective EF-induced cell polarization and motility. (A) EF polarizes symmetric stationary single cell from the rear in minutes; a myosin/contraction, protrusion-independent, mechanism driving retraction of the future rear is responsible for the polarization. After the initial polarization, the robust lamellipodial protrusion starts and guides the rapidly moving cell to the cathode. The cell responds to EF reversal by a U-turn or repolarization to go to the new cathode. (B) When PI3K is inhibited, the initial polarization is the same because PI3K does not affect the myosin/contraction, protrusion-independent, mechanism. (C) When myosin is inhibited, EF can still polarize the cell, but the resulting motility and cell shape are relatively random and unsteady. (D, E) Inside the cohesive group, cells sense EF individually, polarizing in minutes much like single cells. We hypothesize that individual cells polarize from the rear and that the myosin/contraction mechanism is dominant for both initial polarization and stable motility. The only significant difference between the control and PI3K-inhibited groups is that protrusions in the leading and trailing cells in the former accelerate the front and slow the rear, while in the latter the regional differences in the group are muted. (F) When myosin is inhibited, the cells lose mutual cohesion. The combined effects of randomized motility of individual cells and frequent collisions with neighbors, resulting in transient contact inhibition of locomotion and pulling on each other, override the guiding effect of EF. (G) Keys for the notations. |