
Fig. 1
- ID
- ZDB-FIG-230905-47
- Publication
- Sun et al., 2023 - Electric field-guided collective motility initiation of large epidermal cell groups
- Other Figures
- All Figure Page
- Back to All Figure Page
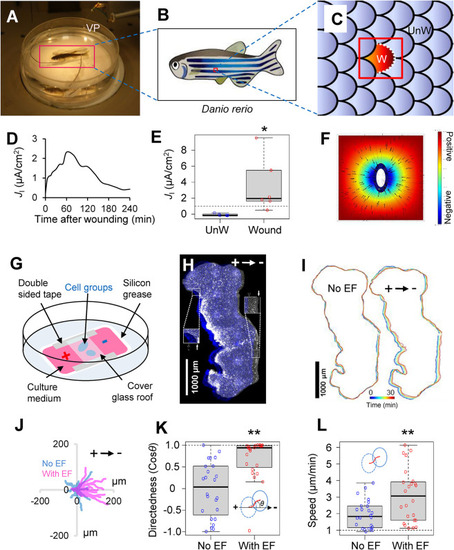
Physiological EF drives epidermal cell groups to the cathode. (A) Experimental setup to define bioelectrical field strength of scale wound–generated EFs. A vibrating probe (VP) is used to measure ionic currents around zebrafish scale wounds. (B) An individual wound was made by pulling a single scale (W). (C) Cartoon to show enlarged area in B. An adjacent scale is chosen as an unwound control (UnW). (D) Time lapse of a typical measurement of outward current up to 4 h after wounding. (E) Significant peak of outward electric current in scale wounds (n = 6) in comparison with unwounded scales (n = 6). *p < 0.05 by Student’s t test. (F) Computational simulation of electric potential based on ionic current measurements in a zebrafish scale wound as depicted in C. The EF direction is oriented to the center of the wound (arrows). Color-coded scale in arbitrary units. (G) Schematic view of the electrotaxis chamber and the setup for EF application. (H) Stitched phase contrast image of a large keratocyte group at the onset (blue) and after 30 min (gray) of the EF application in the indicated orientation. Inserts represent 2× magnification of checked cathodal/anodal edge areas. Arrows mark group’s boundaries before (open arrow) and after (solid arrow) EF application. This group contains approximately 13,600 cells. Scale bar, 1000 µm. (I) Group’s contour overlay before and after EF application, each for 30 min in a 5 min interval. Contours are color coded as shown in the color bar. Scale bar, 1000 µm. (J) Trajectories of keratocyte groups’ centroids (n = 17 for each condition). Duration: 30 min with (red) or without (blue) EF. Arrow indicates EF orientation. (K) Quantification of group directionality with (n = 24) or without (n = 24) EF (2 V/cm) application. Group migration (dash-lined and blue-lined eclipses) was tracked by monitoring centroid movement of each keratocyte group (red line). Directionality was calculated as cosθ. θ is the angle between the applied EF vector and vector (dashed line) connecting the first and last centroids of a group. **p < 0.01 by Student’s t test. (L) Quantification of group migration speed with (n = 24) or without (n = 24) EF (2 V/cm) application. Migration speed is calculated as the arc length of the trajectory (red curve) divided by the time. **p < 0.01 by Student’s t test. |