
|
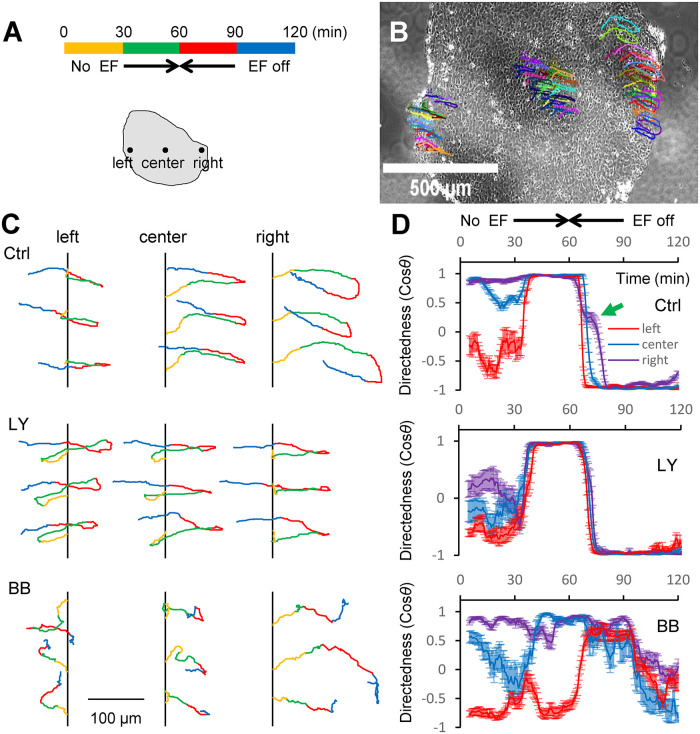
Fig. 4
Myosin is necessary for collective EF sensing and EF-induced U-turns. (A) Color-coded time sequence of No EF, EF (2 V/cm) to the right, EF (2 V/cm) to the left, and EF off in 30 min intervals. Schematic below the time sequence shows three regions at the left, center, and right of the group from which cells are tracked. (B) U-turn tracks overlaid on the phase contrast image of the cell group. Each curve represents an individual cell trajectory. Arbitrary different colors are used to distinguish trajectories more easily. See also Supplemental Movies S8–S11. (C) Three randomly chosen cell trajectories are shown from each of the three regions of the group marked in A for each of the three chemical conditions—in the absence (Ctrl) or presence of 50 µM PI3K inhibitor LY294002 (LY) or myosin phosphorylation inhibitor BB. For visual clarity, in each set of three trajectories, the initial x-coordinate is shifted to the same vertical line while the initial y-coordinate is shifted to sufficiently separate the trajectories. The color coding along the trajectories is the same as in A to better visualize the directions in which the cells are moving during each of the four EF time intervals. Scale bar, 100 μm. (D) Dynamics of mean directedness (cosθ) of regional cells (color codes and timescale apply to all three plots). Directedness is calculated in 5 min intervals of representative groups in at least two repeated experiments in each condition. Error bars are SEs for n regional cells (n between 15 and 20) for each region. The green arrow points to delayed directional response of former “leader”/new “trailer” cells in Ctrl.