
|
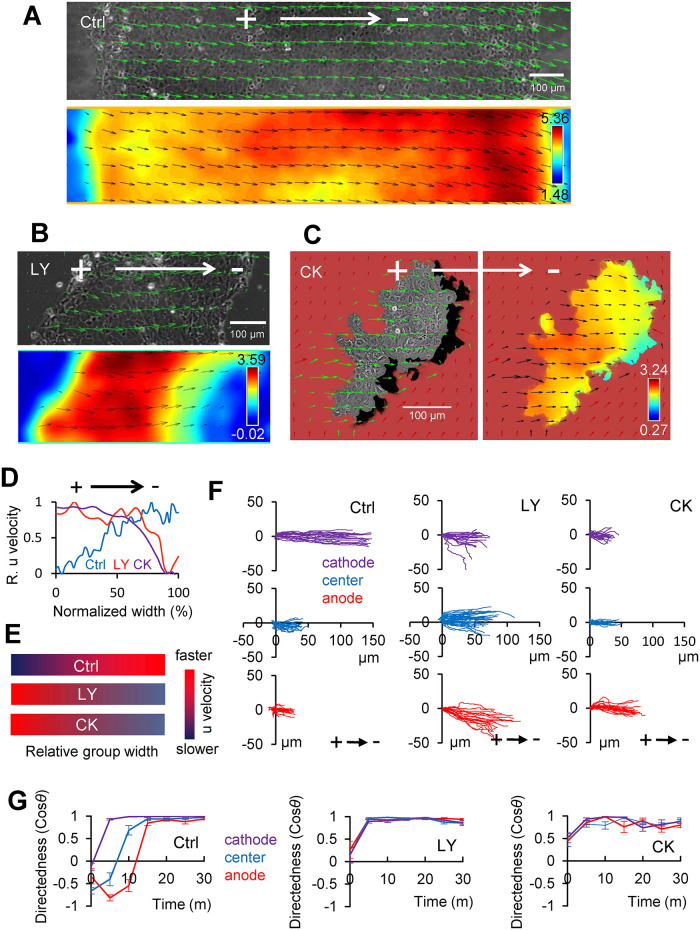
Fig. 3
Inhibition of PI3K and Arp2/3 complex does not change cathodal motility of the whole group but reverses the velocity gradient within the group. (A) PIV maps of keratocyte groups in the absence (Ctrl) or (B) presence of 50 µM LY294002 compound (LY) or (C) CK666 (CK). Velocity vectors are overlaid on the phase contrast image of a slice of the group at the initial point or color-coded u-velocity map after 30 min of EF exposure (2 V/cm in the indicated direction). Scale bar, 100 μm. (D) Line scan of u-velocity (normalized from minimum [0] to maximum [1]) spanning groups in parallel to EF (the distance across the group’s width is normalized from 0 at the anode to 1 at the cathodal side). Note the reversed front-to-rear velocity gradient in the presence of LY or CK compared with that of the Ctrl. (E) Schematic summary of the velocity gradients in these three cases. (F) Manually tracked cell trajectories from the anodal, cathodal, and central regions. Each line represents an individual keratocyte (n = 20 from each color-coded zone) over a 30 min time course of EF application (2 V/cm in the indicated direction). Distances are in µm. (G) Dynamics of mean directedness (cosθ) of cells in three regions of Ctrl, LY, and CK groups under EF application (2 V/cm). Directedness is calculated from a representative group in at least three repeated experiments. Error bars are SE across for n = 20 regional cells.