
- Title
-
Increased circulating uric acid aggravates heart failure via impaired fatty acid metabolism
- Authors
- Lou, B., Wu, H., Ott, H., Bennewitz, K., Wang, C., Poschet, G., Liu, H., Yuan, Z., Kroll, J., She, J.
- Source
- Full text @ J Transl Med
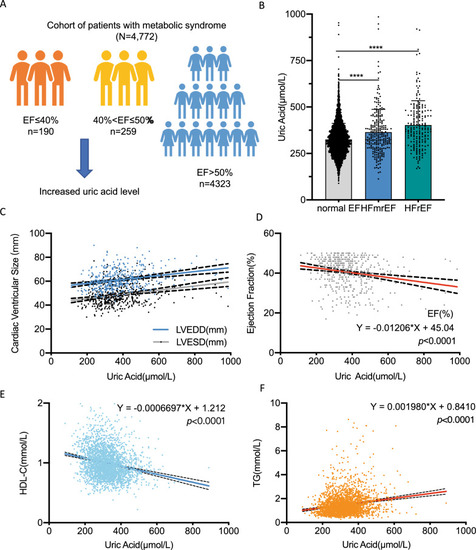
Circulating uric acid was negatively correlated to cardiac function, high density lipoprotein and positively correlated to triglycerides in metabolic syndrome cohort. A Schematic diagram of the correlation between uric acid level and EF value in metabolic syndrome: in the patients with EF ≤ 40% (n = 190) and 40% < EF ≤ 50% (n = 259), increased uric acid level was observed; B Column plot of uric acid level among HFrEF, HFmrEF and normal EF patients; C, D In metabolic syndrome cohort: circulating uric acid was significantly negatively correlated to cardiac function: positively correlated to cardiac ventricular size (C) and negatively correlated to EF value (D); E Circulating uric acid was negatively to high density lipoprotein; F Circulating uric acid was positively to triglycerides in metabolic syndrome patients. Each single dot represents one patient’s data in the above plots. EF, ejection fraction; HFmrEF, heart failure with mid-range ejection fraction; HFrEF, heart failure with reduced ejection fraction; HDL-C, high density lipoprotein; TG, triglycerides |

Increased FFA and uric acid levels in heart failure patients. A Schematic diagram of the metabolomics measurements in HFrEF and control patients with metabolic syndrome. B Column plot of uric acid level among HFrEF and normal EF patients in this cohort; C Column plot of each FFA level among HFrEF and normal EF patients in this cohort. N = 23–25 per group as the dot showed in the column plot. For statistical analysis student T test was applied, *p < 0.05, **p < 0.01, ***p < 0.001. UA, uric acid; HFrEF, heart failure with reduced ejection fraction; FFA, free fatty acid; SFA, saturated fatty acid; MUFA, monounsaturated fatty acid; PUFA, polyunsaturated fatty acid |
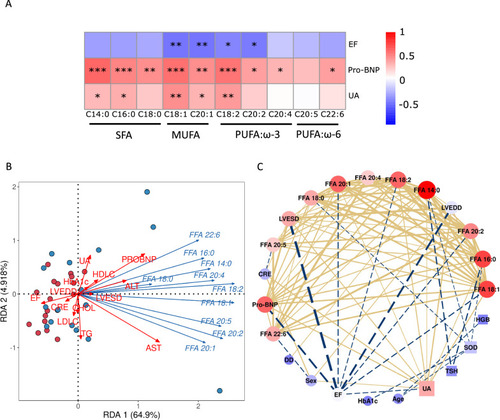
Uric acid correlated to circulating lipids profile based on metabolomics in heart failure patients. A Heatmap showed uric acid positively correlated and cardiac function reversely correlated to circulating lipids. The color in each cell represents value of correlation calculated by Spearman’s rank correlation coefficient. *p < 0.05, **p < 0.01, ***p < 0.001. B, C network analysis between fatty acid and clinical parameters. UA, uric acid; HFrEF, heart failure with reduced ejection fraction; FFA, free fatty acid; SFA, saturated fatty acid; MUFA, monounsaturated fatty acid; PUFA, polyunsaturated fatty acid |
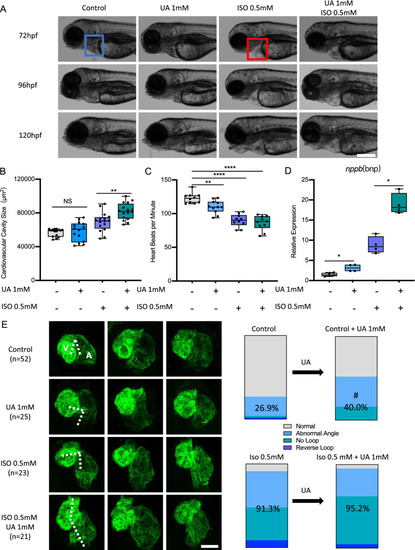
Uric acid aggravated ISO induced heart failure in zebrafish. A–D 1 mM Uric acid treatment aggravated 0.5 mM ISO induced heart failure in Tg(fli1:EGFP) zebrafish larvae at 72, 96 and 120 hpf. Representative light microscopic images A showed the gross morphology of zebrafish larvae, blue frame indicates normal cardiovascular cavity and red frame indicates edema cardiovascular cavity, white scale bar = 200 μm; Heart failure was quantified by increased cardiovascular cavity size (B), decreased heart beats per minute (C) and increased nppb expression (D) at 120hpf, expression of mRNA was analysed by RT-qPCR and was normalized to both b-actin and b2m. In each group, 10–16 zebrafish larvae were used in A–C, each single dot represent one zebrafish larva. In D one single dot represents one zebrafish cluster’s data, which includes 20–30 zebrafish larvae. For statistical analysis one-way ANOVA followed by Sidak’s multiple comparison test was applied, *p < 0.05, **p < 0.01, ****p < 0.0001. E.1 mM UA treatment increased long-stretched heart with loop failure, including abnormal angle, reverse loop and no loop phenotype as compared to controls in Tg(myl7:EGFP) zebrafish larvae at 72hpf. Also, 1 mM UA and ISO co-treatment aggravated “no loop” phenotype ratio as compared to ISO treatment. N = zebrafish larvae analysed in each group. Dash indicates angle between atrium and ventricle, white scale bar = 50 μm. A, atrium; V, ventricle. Percentage in the column represents “abnormal heart phenotype” ratio in each group, including abnormal angle, reverse loop and no loop. #p < 0.05 as compared to controls. UA, uric acid; ISO, isoproterenol |
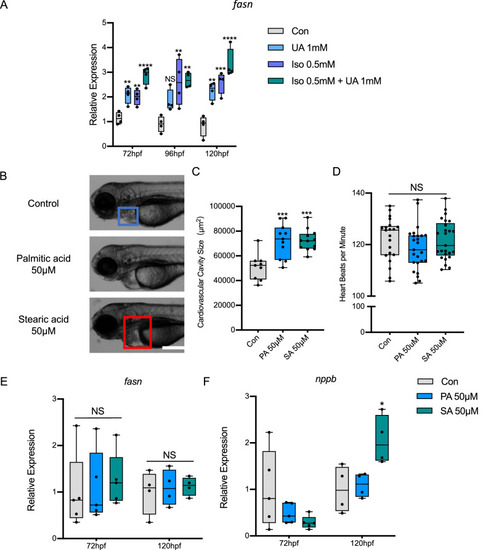
Uric acid aggravated heart failure is most likely driven by FFA accumulation through SREBP1/FASN pathway. A 1 mM UA treatment and 0.5 mM ISO induced increased Fasn and Srebp1 mRNA expression in Tg(fli1:EGFP) zebrafish larvae at 72, 96 and 120 hpf. B–F, FFA treatments, including 50 μM Palmitic acid and Stearic acid incubation, caused heart failure in Tg(fli1:EGFP) zebrafish larvae, quantified by increased cardiovascular cavity size (B, C) and nppb level at 120hpf (E), heart beats per minute (D) and Fasn (F) level were not altered. In A, E, F, expression of mRNA was analysed by RT-qPCR and was normalized to both b-actin and b2m, each single dot represents one zebrafish cluster’s data, which includes 20–30 zebrafish larvae. In B–D, 9–25 zebrafish larvae were used in each group and each single dot represents one zebrafish’s data. For statistical analysis one-way ANOVA followed by Sidak’s multiple comparison test was applied, *p < 0.05, **p < 0.01, ***p < 0.001, ****p < 0.0001. UA, uric acid; ISO, isoproterenol; PA, palmitic acid; SA, stearic acid. FFA, free fatty acid |
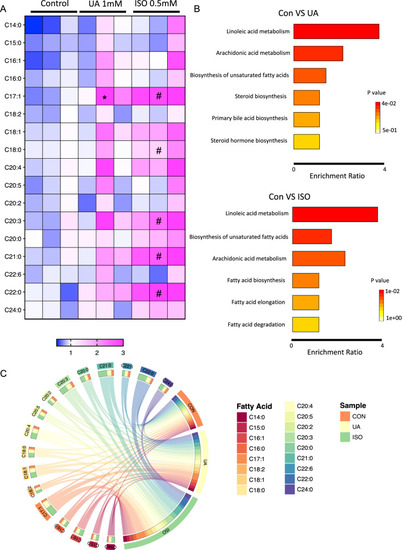
Uric acid and ISO induced heart failure leads to impaired fatty acid metabolism in zebrafish. A Heatmap of several increased fatty acids in UA and ISO induced heart failure zebrafish larvae at 96 hpf. The color in each cell represents the expression of each zebrafish cluster sample as the scale bar showed, each zebrafish cluster includes 50 zebrafish larvae. For statistical analysis, two-way analysis of variance (ANOVA) followed by Holm-Sidak test was used to evaluate the statistical significance of differences among three groups. *: Con versus UA p < 0.05; #: Con versus ISO p < 0.05; B Enrichment analysis of fatty acid profiles and TOP6 pathways between Con versus UA and Con versus ISO group. C Circos plot of fatty acids among each group |
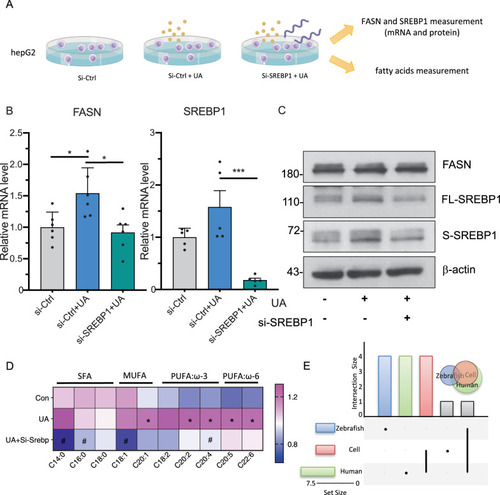
Uric acid treatment increases FASN/SREBP1 expression and FFA accumulation in HepG2 and can be rescued via SREBP1 knock down. A Schematic diagram of the cell culture, HepG2 were transfected with SREBP1 siRNA or control siRNA for 24 h followed by 1 mM UA treatment for another 48 h. The SERBP1 and FASN mRNA and protein levels, and fatty acids were measured and analyzed then. B Column plot of SERBP1 and FASN mRNA expression. N = 6 per each group. The average values of Si-Ctrl were standardized to 1, *p < 0.05 as compared to control group; For statistical analysis one-way ANOVA followed by Sidak’s multiple comparison test was applied, #p < 0.05 as compared to UA group. C Western blot of SERBP1 and FASN protein expression, n = 3 per group. SREBP1 signaling can be detected as an ~ 68 splicing and 120 kDa full-length protein bands. D Heatmap showed uric acid positively correlated to several lipids in HepG2 cell and can be rescued via SREBP1 knock down. The color in each cell represents value of correlation calculated by Spearman’s rank correlation coefficient. *p < 0.05 as compared to control group; #p < 0.05 as compared to UA group. E Venn diagram displays the distribution of shared FFA alteration after uric acid treatment in cell, zebrafish and human dataset. FASN, fatty acid synthase; SREBP1, sterol regulatory element binding protein 1 |
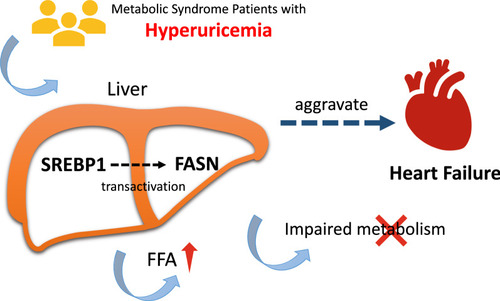
Graphical abstract/Mechanism plot. Increased UA level may regulate FASN via SREBP1 signaling pathway, leading FFA accumulation and impaired energy metabolism, which aggravates heart failure in metabolic syndrome patients ulteriorly |