
Fig. 2
- ID
- ZDB-IMAGE-230319-43
- Publication
- Lou et al., 2023 - Increased circulating uric acid aggravates heart failure via impaired fatty acid metabolism
- All Figures
- Figures for Lou et al., 2023
|
Fig. 2
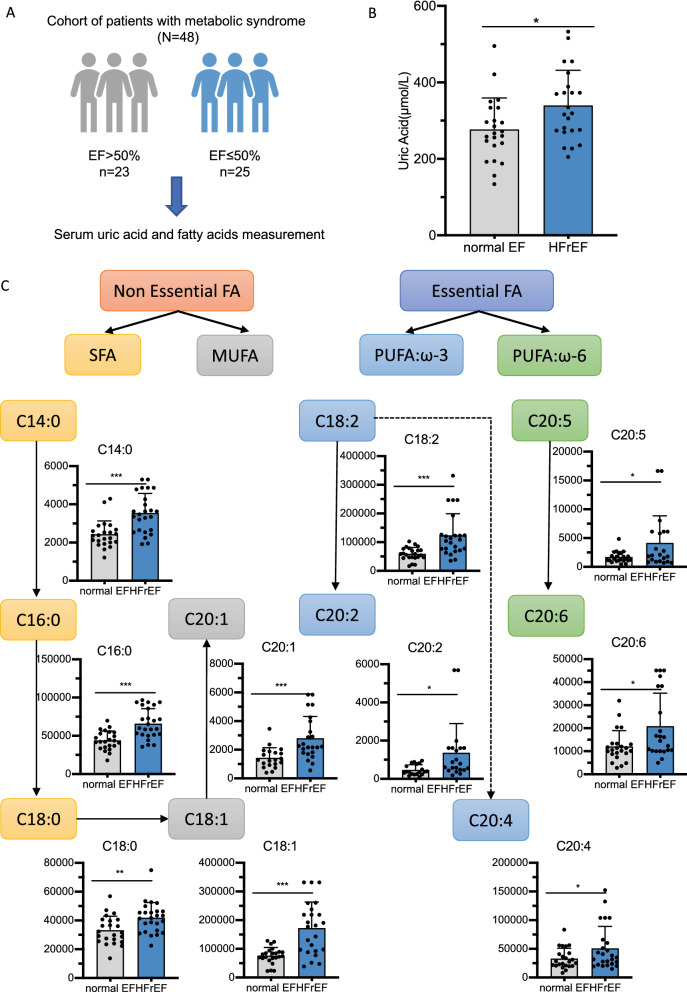
Increased FFA and uric acid levels in heart failure patients. A Schematic diagram of the metabolomics measurements in HFrEF and control patients with metabolic syndrome. B Column plot of uric acid level among HFrEF and normal EF patients in this cohort; C Column plot of each FFA level among HFrEF and normal EF patients in this cohort. N = 23–25 per group as the dot showed in the column plot. For statistical analysis student T test was applied, *p < 0.05, **p < 0.01, ***p < 0.001. UA, uric acid; HFrEF, heart failure with reduced ejection fraction; FFA, free fatty acid; SFA, saturated fatty acid; MUFA, monounsaturated fatty acid; PUFA, polyunsaturated fatty acid