
Fig. 1
- ID
- ZDB-IMAGE-230319-42
- Publication
- Lou et al., 2023 - Increased circulating uric acid aggravates heart failure via impaired fatty acid metabolism
- All Figures
- Figures for Lou et al., 2023
|
Fig. 1
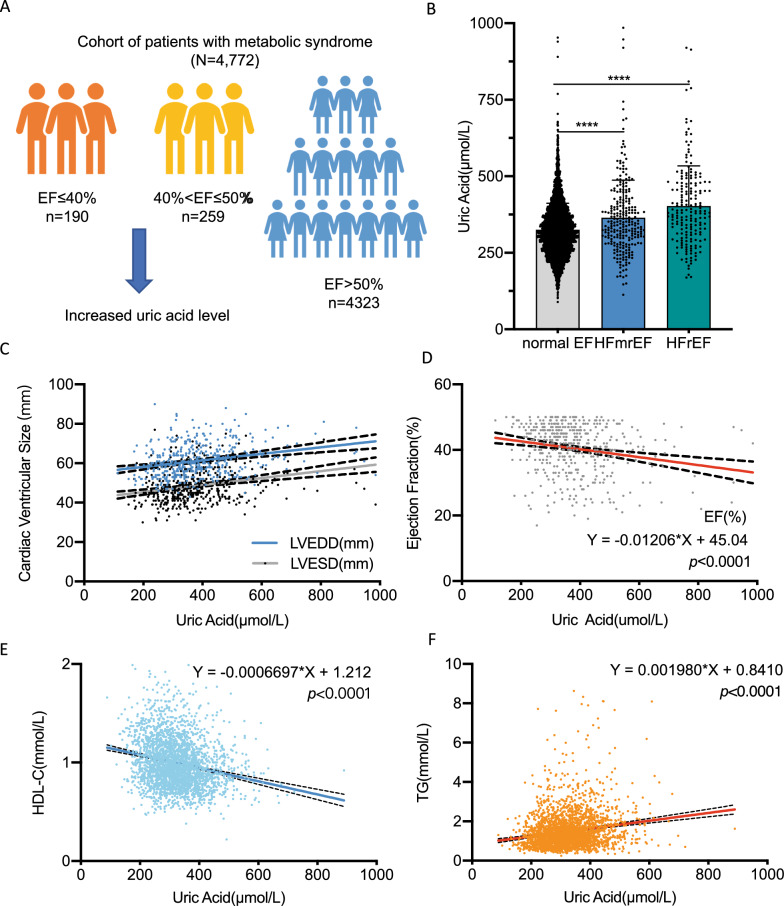
Circulating uric acid was negatively correlated to cardiac function, high density lipoprotein and positively correlated to triglycerides in metabolic syndrome cohort. A Schematic diagram of the correlation between uric acid level and EF value in metabolic syndrome: in the patients with EF ≤ 40% (n = 190) and 40% < EF ≤ 50% (n = 259), increased uric acid level was observed; B Column plot of uric acid level among HFrEF, HFmrEF and normal EF patients; C, D In metabolic syndrome cohort: circulating uric acid was significantly negatively correlated to cardiac function: positively correlated to cardiac ventricular size (C) and negatively correlated to EF value (D); E Circulating uric acid was negatively to high density lipoprotein; F Circulating uric acid was positively to triglycerides in metabolic syndrome patients. Each single dot represents one patient’s data in the above plots. EF, ejection fraction; HFmrEF, heart failure with mid-range ejection fraction; HFrEF, heart failure with reduced ejection fraction; HDL-C, high density lipoprotein; TG, triglycerides