
Fig. 4
- ID
- ZDB-IMAGE-230319-45
- Genes
- Publication
- Lou et al., 2023 - Increased circulating uric acid aggravates heart failure via impaired fatty acid metabolism
- All Figures
- Figures for Lou et al., 2023
|
Fig. 4
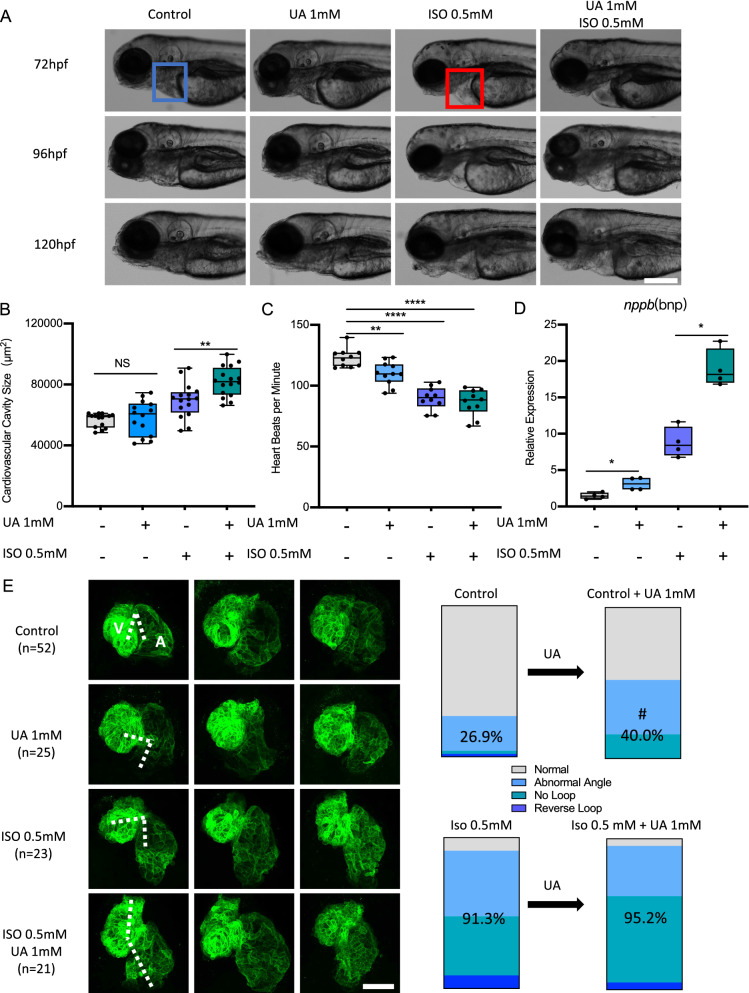
Uric acid aggravated ISO induced heart failure in zebrafish. A–D 1 mM Uric acid treatment aggravated 0.5 mM ISO induced heart failure in Tg(fli1:EGFP) zebrafish larvae at 72, 96 and 120 hpf. Representative light microscopic images A showed the gross morphology of zebrafish larvae, blue frame indicates normal cardiovascular cavity and red frame indicates edema cardiovascular cavity, white scale bar = 200 μm; Heart failure was quantified by increased cardiovascular cavity size (B), decreased heart beats per minute (C) and increased nppb expression (D) at 120hpf, expression of mRNA was analysed by RT-qPCR and was normalized to both b-actin and b2m. In each group, 10–16 zebrafish larvae were used in A–C, each single dot represent one zebrafish larva. In D one single dot represents one zebrafish cluster’s data, which includes 20–30 zebrafish larvae. For statistical analysis one-way ANOVA followed by Sidak’s multiple comparison test was applied, *p < 0.05, **p < 0.01, ****p < 0.0001. E.1 mM UA treatment increased long-stretched heart with loop failure, including abnormal angle, reverse loop and no loop phenotype as compared to controls in Tg(myl7:EGFP) zebrafish larvae at 72hpf. Also, 1 mM UA and ISO co-treatment aggravated “no loop” phenotype ratio as compared to ISO treatment. N = zebrafish larvae analysed in each group. Dash indicates angle between atrium and ventricle, white scale bar = 50 μm. A, atrium; V, ventricle. Percentage in the column represents “abnormal heart phenotype” ratio in each group, including abnormal angle, reverse loop and no loop. #p < 0.05 as compared to controls. UA, uric acid; ISO, isoproterenol