
- Title
-
Microarray transcriptome datasets of maternal-zygotic DNA methyltransferase 3aa-/- zebrafish during early developmental stages
- Authors
- Shirai, M., Shimoda, N., Takahashi, H., Takayama, K., Kikuchi, Y.
- Source
- Full text @ Data Brief
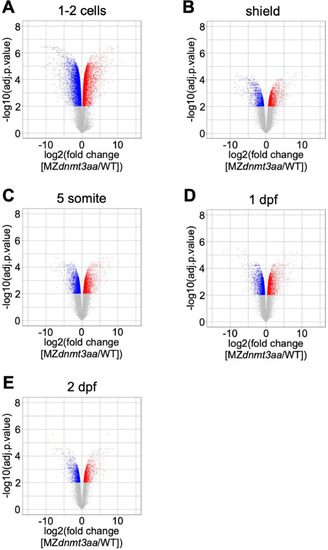
Volcano plots of differentially expressed genes based on samples of five developmental stages: (A) 1–2 cell, (B) shield, (C) 5-somite, (D) 1 dpf, and (E) 2 dpf. Red and blue dots indicate significantly up- and down-regulated genes, respectively. Gray dots are genes that have not changed significantly. |
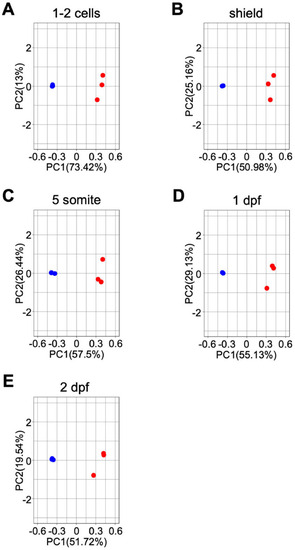
PCA of the data obtained from samples of 5 developmental stages: (A) 1–2 cell, (B) shield, (C) 5-somite, (D) 1 dpf, and (E) 2 dpf. Blue and red dots indicate WT and MZ |
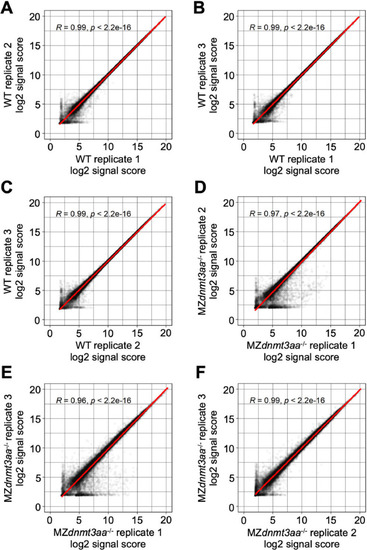
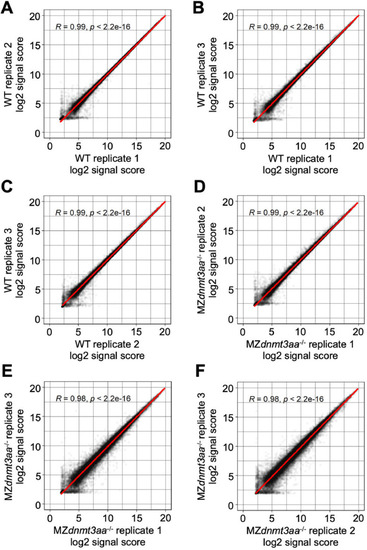
Correlation graph of log2 signal score between replications in 1–2 cell stage samples. Each dot indicates the signal score of each gene and the red line shows the linear regression. |
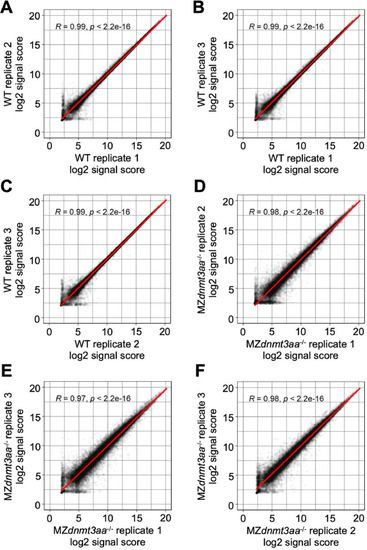
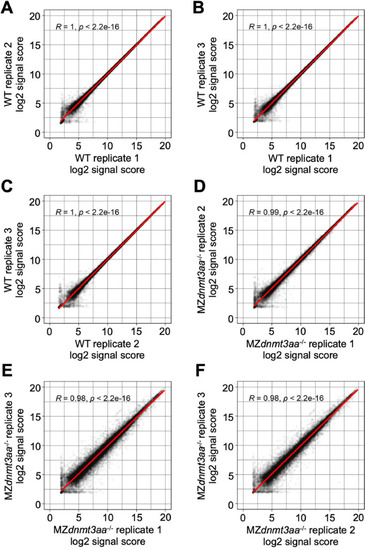
Correlation graph of log2 signal score between replications in shield stage samples. Each dot indicates the signal score of each gene and the red line shows the linear regression. |
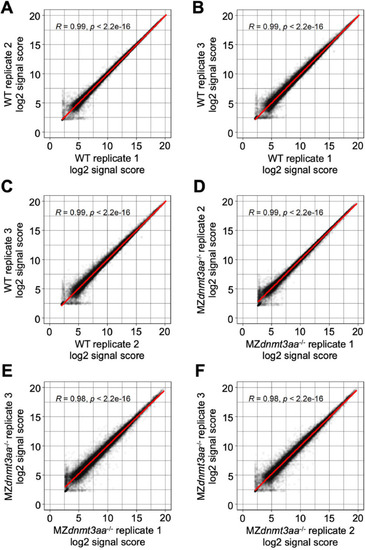
Correlation graph of log2 signal score between replications in 5-somite stage samples. Each dot indicates the signal score of each gene and the red line shows the linear regression. |
Correlation graph of log2 signal score between replications in 1 dpf stage samples. Each dot indicates the signal score of each gene and the red line shows the linear regression. |
Correlation graph of log2 signal score between replications in 2 dpf stage samples. Each dot indicates the signal score of each gene and the red line shows the linear regression. |