
Image
|
Figure Caption
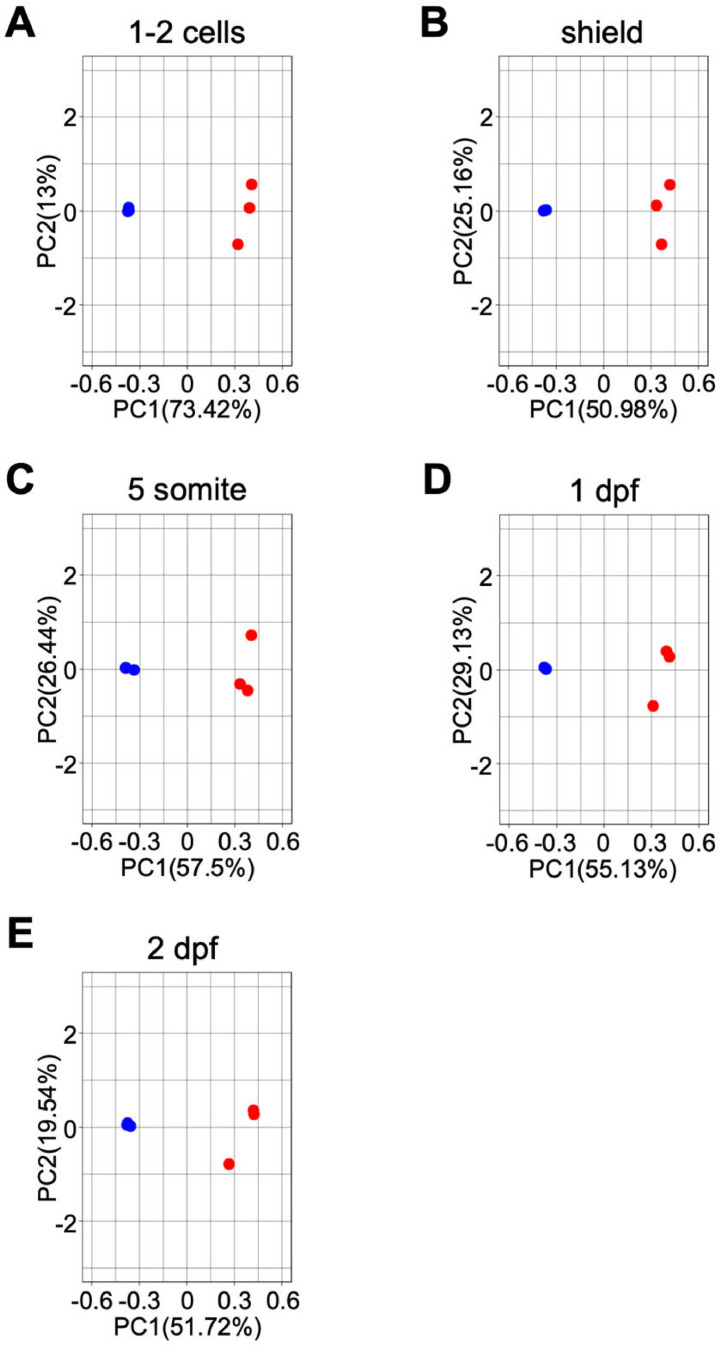
Fig. 2
PCA of the data obtained from samples of 5 developmental stages: (A) 1–2 cell, (B) shield, (C) 5-somite, (D) 1 dpf, and (E) 2 dpf. Blue and red dots indicate WT and MZ
Acknowledgments
This image is the copyrighted work of the attributed author or publisher, and
ZFIN has permission only to display this image to its users.
Additional permissions should be obtained from the applicable author or publisher of the image.
Full text @ Data Brief