
Image
|
Figure Caption
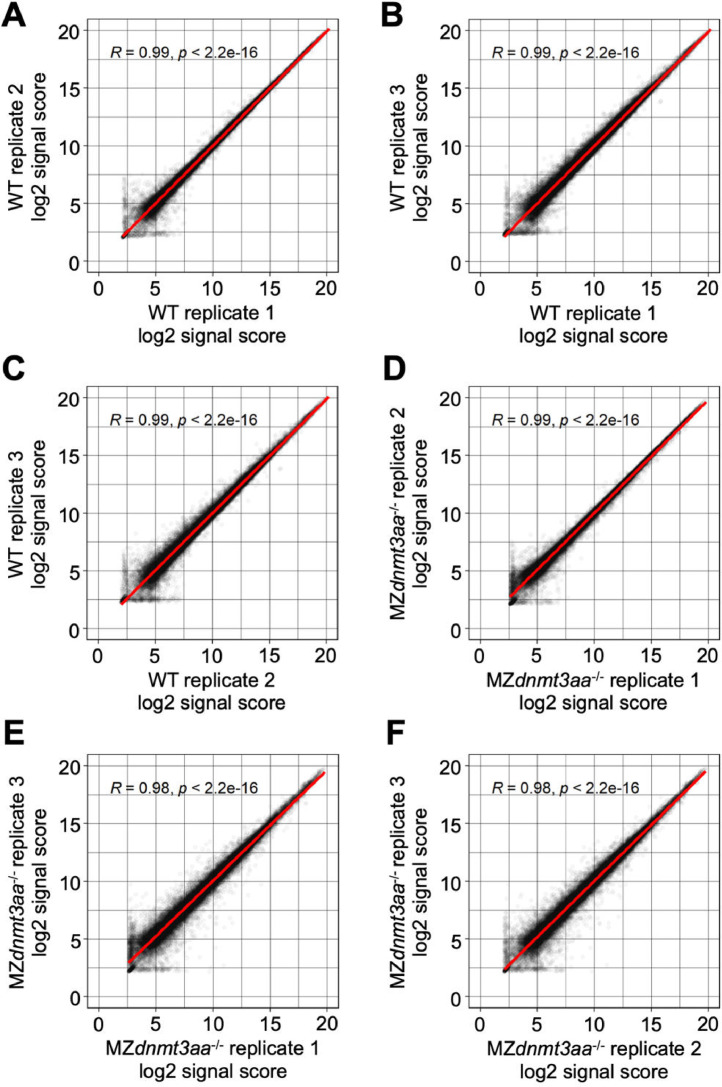
Fig. 7
Correlation graph of log2 signal score between replications in 2 dpf stage samples.
Each dot indicates the signal score of each gene and the red line shows the linear regression.
Acknowledgments
This image is the copyrighted work of the attributed author or publisher, and
ZFIN has permission only to display this image to its users.
Additional permissions should be obtained from the applicable author or publisher of the image.
Full text @ Data Brief