
Image
|
Figure Caption
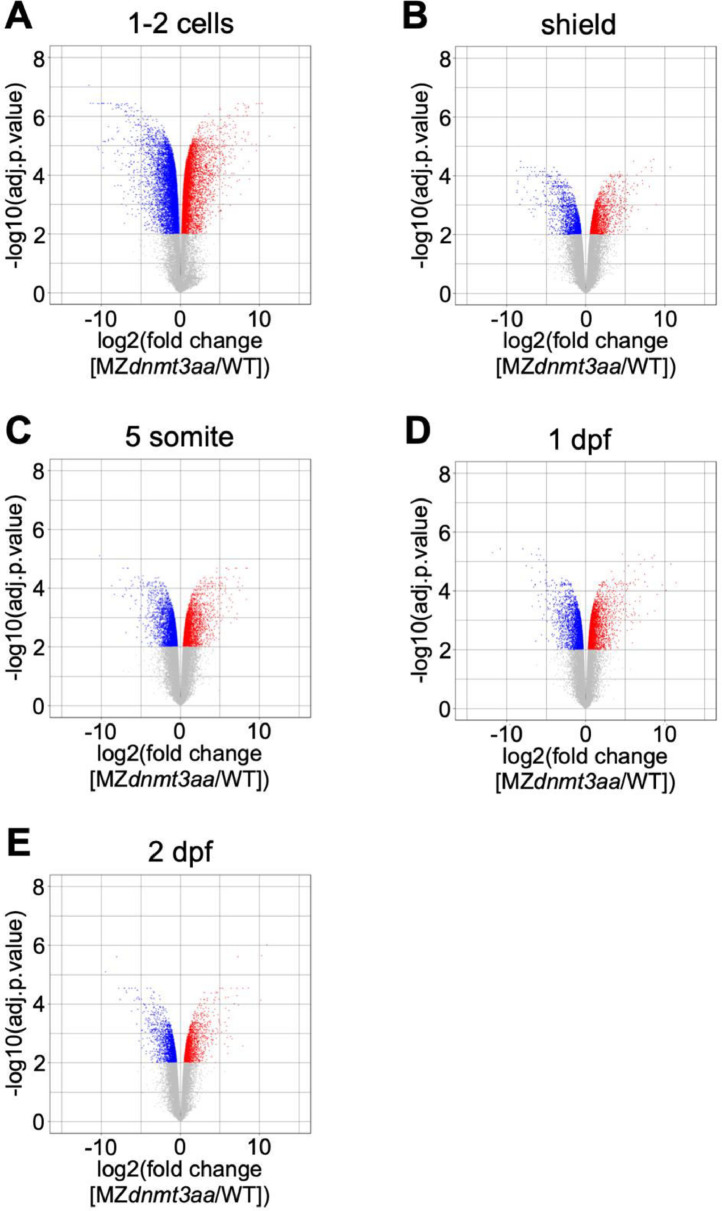
Fig. 1
Volcano plots of differentially expressed genes based on samples of five developmental stages: (A) 1–2 cell, (B) shield, (C) 5-somite, (D) 1 dpf, and (E) 2 dpf. Red and blue dots indicate significantly up- and down-regulated genes, respectively. Gray dots are genes that have not changed significantly.
Acknowledgments
This image is the copyrighted work of the attributed author or publisher, and
ZFIN has permission only to display this image to its users.
Additional permissions should be obtained from the applicable author or publisher of the image.
Full text @ Data Brief